# Technical Document Analysis of Stacked Bar Chart
## Labels and Axis Titles
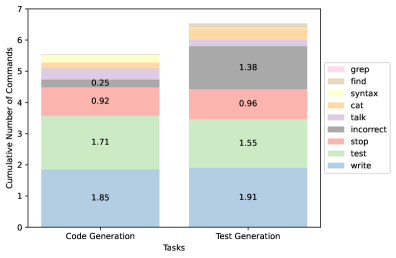
- **X-Axis (Tasks)**:
- Categories: `Code Generation`, `Test Generation`
- **Y-Axis**:
- Label: `Cumulative Number of Commands`
- Scale: 0 to 7 (increments of 1)
- **Legend (Categories and Colors)**:
- `grep` (pink)
- `find` (beige)
- `syntax` (yellow)
- `cat` (orange)
- `talk` (purple)
- `incorrect` (gray)
- `stop` (red)
- `test` (green)
- `write` (blue)
## Data Points and Categories
### Code Generation Task
- **Cumulative Values (from bottom to top)**:
- `write`: 1.85 (blue)
- `test`: 1.71 (green)
- `stop`: 0.92 (red)
- `incorrect`: 0.25 (gray)
- `talk`: 0.12 (purple)
- `syntax`: 0.08 (yellow)
- `cat`: 0.05 (orange)
- `find`: 0.03 (beige)
- `grep`: 0.02 (pink)
### Test Generation Task
- **Cumulative Values (from bottom to top)**:
- `write`: 1.91 (blue)
- `test`: 1.55 (green)
- `incorrect`: 1.38 (gray)
- `stop`: 0.96 (red)
- `talk`: 0.07 (purple)
- `syntax`: 0.05 (yellow)
- `cat`: 0.04 (orange)
- `find`: 0.03 (beige)
- `grep`: 0.02 (pink)
## Key Trends
1. **Dominant Categories**:
- `write` and `test` commands dominate both tasks, contributing ~1.8–1.9 and ~1.5–1.7 respectively.
- `incorrect` commands are significantly higher in `Test Generation` (1.38) compared to `Code Generation` (0.25).
2. **Minor Categories**:
- `grep`, `find`, `syntax`, `cat`, and `talk` contribute negligible values (<0.1) in both tasks.
3. **Stacking Order**:
- `Code Generation` stacks `stop` above `test`, while `Test Generation` stacks `incorrect` above `test`.
## Data Table Reconstruction
| Category | Code Generation | Test Generation |
|--------------|-----------------|-----------------|
| write | 1.85 | 1.91 |
| test | 1.71 | 1.55 |
| stop | 0.92 | 0.96 |
| incorrect | 0.25 | 1.38 |
| talk | 0.12 | 0.07 |
| syntax | 0.08 | 0.05 |
| cat | 0.05 | 0.04 |
| find | 0.03 | 0.03 |
| grep | 0.02 | 0.02 |
## Notes
- The chart uses **stacked bars** to show cumulative contributions of categories to each task.
- Colors in the legend **strictly align** with bar segments (e.g., `incorrect` is gray in both tasks).
- Numerical values are embedded within the chart segments for precision.