## Violin Plot: High School Biology Accuracy
### Overview
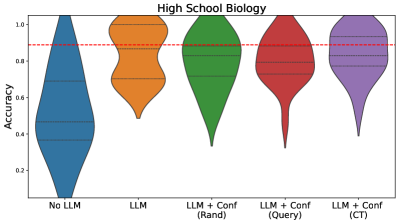
The image is a violin plot comparing the accuracy of different models on a High School Biology task. The models include a baseline with no LLM, a model using an LLM, and three models combining an LLM with confidence measures (Random, Query, and CT). The y-axis represents accuracy, ranging from 0 to 1.0. A red dashed line is present at approximately 0.88 accuracy.
### Components/Axes
* **Title:** High School Biology
* **Y-axis Label:** Accuracy
* **Y-axis Scale:** 0.0 to 1.0, with ticks at 0.2, 0.4, 0.6, 0.8, and 1.0.
* **X-axis Labels (Categories):**
* No LLM (Blue)
* LLM (Orange)
* LLM + Conf (Rand) (Green)
* LLM + Conf (Query) (Red)
* LLM + Conf (CT) (Purple)
* **Horizontal Dashed Line:** Red, located at approximately 0.88 accuracy.
### Detailed Analysis
* **No LLM (Blue):** The violin plot is wide at lower accuracy values and tapers towards the top. The distribution is skewed towards lower accuracy, with the majority of data points appearing to be below 0.6.
* **LLM (Orange):** The violin plot is concentrated between approximately 0.5 and 1.0 accuracy. The distribution appears more uniform than "No LLM," with a slight bulge around 0.8.
* **LLM + Conf (Rand) (Green):** The violin plot is concentrated between approximately 0.4 and 1.0 accuracy. The distribution appears more uniform than "No LLM," with a slight bulge around 0.9.
* **LLM + Conf (Query) (Red):** The violin plot is concentrated between approximately 0.3 and 1.0 accuracy. The distribution appears more uniform than "No LLM," with a slight bulge around 0.9.
* **LLM + Conf (CT) (Purple):** The violin plot is concentrated between approximately 0.4 and 1.0 accuracy. The distribution appears more uniform than "No LLM," with a slight bulge around 0.9.
### Key Observations
* The "No LLM" model has the lowest accuracy, with a distribution skewed towards lower values.
* Adding an LLM significantly improves accuracy compared to the "No LLM" baseline.
* The three models that combine an LLM with confidence measures ("Rand," "Query," and "CT") show similar accuracy distributions, with a slight concentration around 0.9.
* The red dashed line at approximately 0.88 accuracy serves as a visual reference point, highlighting the performance of the LLM-based models relative to a specific threshold.
### Interpretation
The violin plot demonstrates the impact of using an LLM on the accuracy of a model for High School Biology tasks. The "No LLM" baseline performs significantly worse than the models incorporating an LLM, indicating the value of LLMs in this context. The addition of confidence measures to the LLM models ("Rand," "Query," and "CT") appears to provide a marginal improvement, with similar distributions concentrated around higher accuracy values. The red dashed line emphasizes that the LLM-based models generally achieve accuracy above this threshold. The plot suggests that LLMs are beneficial for this task, and further investigation could explore the differences between the various confidence measure approaches.