\n
## Violin Plot: High School Biology Accuracy Comparison
### Overview
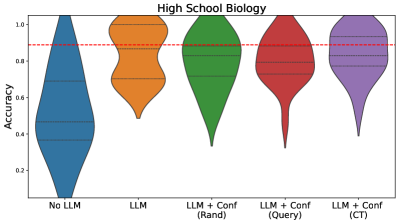
The image displays a violin plot comparing the accuracy distributions of five different models or conditions on a "High School Biology" task. The chart visualizes the probability density of accuracy scores for each group, showing both the range and concentration of results.
### Components/Axes
- **Title**: "High School Biology" (centered at the top).
- **Y-axis**: Labeled "Accuracy". The scale runs from 0.2 to 1.0, with major tick marks at 0.2, 0.4, 0.6, 0.8, and 1.0.
- **X-axis**: Contains five categorical labels, each corresponding to a colored violin plot:
1. **No LLM** (Blue)
2. **LLM** (Orange)
3. **LLM + Conf (Randi)** (Green)
4. **LLM + Conf (Query)** (Red)
5. **LLM + Conf (CT)** (Purple)
- **Reference Line**: A horizontal red dashed line is positioned at an accuracy value of approximately 0.9.
- **Legend**: The categories are labeled directly on the x-axis; there is no separate legend box. The color of each violin corresponds to its x-axis label.
### Detailed Analysis
Each violin plot shows the distribution of accuracy scores for its group. The width of the violin at any given y-value represents the density of data points at that accuracy level. Horizontal lines within each violin likely represent quartiles (median, 25th, and 75th percentiles).
1. **No LLM (Blue, far left)**:
- **Trend/Shape**: The distribution is widest at the bottom (low accuracy) and tapers sharply towards the top. It has the lowest median and the largest spread in the lower accuracy range.
- **Key Points**: The bulk of the data is concentrated between ~0.2 and 0.6 accuracy. The median appears to be around 0.45. The distribution extends from near 0.0 to just above 0.8.
2. **LLM (Orange, second from left)**:
- **Trend/Shape**: Shows a bimodal or wide-shouldered distribution. It is dense in two regions: one around 0.6-0.7 and another, larger concentration around 0.8-0.95.
- **Key Points**: The median is significantly higher than the "No LLM" group, sitting at approximately 0.8. The distribution is tighter overall, ranging from about 0.5 to 1.0.
3. **LLM + Conf (Randi) (Green, center)**:
- **Trend/Shape**: The distribution is fairly symmetric and pear-shaped, with the widest point (highest density) around the median.
- **Key Points**: The median is slightly above 0.8. The data is concentrated between ~0.6 and 0.95, with a long, thin tail extending down to about 0.3.
4. **LLM + Conf (Query) (Red, second from right)**:
- **Trend/Shape**: Similar in shape to the "Randi" plot but shifted slightly upward. It is dense around the median and tapers smoothly.
- **Key Points**: The median is close to 0.85. The main body of data lies between ~0.7 and 0.95, with a tail reaching down to ~0.4.
5. **LLM + Conf (CT) (Purple, far right)**:
- **Trend/Shape**: This plot has the highest and most concentrated distribution. It is widest just below the 0.9 reference line.
- **Key Points**: The median is the highest of all groups, at approximately 0.88-0.89, very close to the red dashed line. The data is tightly clustered between ~0.75 and 0.95, with a tail extending down to ~0.5.
### Key Observations
- **Performance Hierarchy**: There is a clear progression in median accuracy from left to right: No LLM < LLM < LLM+Conf (Randi) < LLM+Conf (Query) < LLM+Conf (CT).
- **Variability**: The "No LLM" group shows the highest variability (widest range). The "LLM + Conf (CT)" group shows the lowest variability, with scores tightly packed near the top.
- **Benchmark**: The red dashed line at 0.9 appears to be a target or benchmark score. Only the "LLM + Conf (CT)" group has a median that approaches this line, and a significant portion of its distribution lies above it.
- **Impact of Confidence Mechanisms**: All three "LLM + Conf" variants outperform the base "LLM" model, suggesting that adding a confidence mechanism improves both median accuracy and consistency (reduces low-end outliers).
### Interpretation
This chart demonstrates the effectiveness of using Large Language Models (LLMs) and, more specifically, LLMs augmented with confidence estimation techniques for a high school biology task.
- **Core Finding**: The data suggests that raw LLM performance ("LLM") is a substantial improvement over no LLM ("No LLM"). However, integrating confidence mechanisms ("+ Conf") provides a further, meaningful boost in both average accuracy and reliability (reduced variance).
- **Mechanism Comparison**: Among the confidence methods, "CT" appears most effective, followed by "Query," then "Randi." This implies the specific method of confidence estimation is a critical design choice.
- **Practical Implication**: The red line at 0.9 likely represents a "mastery" or "production-ready" threshold. The "LLM + Conf (CT)" model is the only one where the central tendency (median) nears this threshold, indicating it may be the only candidate suitable for deployment where high accuracy is critical. The other models, while improved, still have medians below this target and greater risk of low-accuracy outputs.
- **Underlying Pattern**: The progression from a wide, low distribution to a narrow, high one illustrates a common pattern in model development: initial gains come from adopting a better base model (LLM), while subsequent gains come from refining its outputs and managing its uncertainty (Confidence mechanisms).