## Violin Plot: High School Biology Accuracy Comparison
### Overview
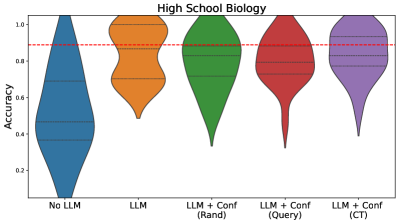
The image is a violin plot comparing the accuracy distributions of five different methods in a high school biology context. The plot includes a benchmark line at 0.85 accuracy, represented by a red dashed horizontal line. Each violin plot is color-coded and labeled to represent distinct experimental conditions.
### Components/Axes
- **X-Axis (Categories)**:
- "No LLM" (blue)
- "LLM" (orange)
- "LLM + Conf (Rand)" (green)
- "LLM + Conf (Query)" (red)
- "LLM + Conf (CT)" (purple)
- **Y-Axis (Accuracy)**: Ranges from 0.0 to 1.0, labeled "Accuracy."
- **Legend**: Located on the right, mapping colors to method labels.
- **Benchmark Line**: Red dashed line at y = 0.85.
### Detailed Analysis
1. **"No LLM" (Blue)**:
- Distribution spans 0.2 to 0.8, with a peak near 0.5.
- Median accuracy ~0.5, indicating low and variable performance.
2. **"LLM" (Orange)**:
- Distribution spans 0.4 to 0.9, with a peak near 0.7.
- Median accuracy ~0.7, showing moderate improvement over "No LLM."
3. **"LLM + Conf (Rand)" (Green)**:
- Distribution spans 0.6 to 0.95, with a peak near 0.8.
- Median accuracy ~0.8, indicating further improvement.
4. **"LLM + Conf (Query)" (Red)**:
- Distribution spans 0.7 to 0.95, with a peak near 0.85.
- Median accuracy ~0.85, aligning with the benchmark line.
5. **"LLM + Conf (CT)" (Purple)**:
- Distribution spans 0.8 to 0.98, with a peak near 0.9.
- Median accuracy ~0.9, the highest among all methods.
### Key Observations
- The red dashed benchmark line at 0.85 is exceeded by "LLM + Conf (Query)" and "LLM + Conf (CT)" methods.
- "LLM + Conf (CT)" achieves the highest median accuracy (~0.9) and narrowest distribution, suggesting the most consistent performance.
- "No LLM" and "LLM" methods show significant variability, with wide distributions and lower medians.
- The progression from "No LLM" to "LLM + Conf (CT)" demonstrates a clear trend of increasing accuracy with added confidence mechanisms.
### Interpretation
The data suggests that incorporating confidence mechanisms (e.g., "Conf (Rand)," "Conf (Query)," "Conf (CT)") significantly improves accuracy in high school biology assessments. The "LLM + Conf (CT)" method outperforms all others, indicating that the "CT" confidence strategy is the most effective. The benchmark line at 0.85 serves as a threshold for acceptable performance, with only the top two methods meeting or exceeding it. The narrowing of distributions in advanced methods implies reduced variability, pointing to more reliable outcomes. This analysis highlights the importance of confidence-based enhancements in LLM applications for educational contexts.