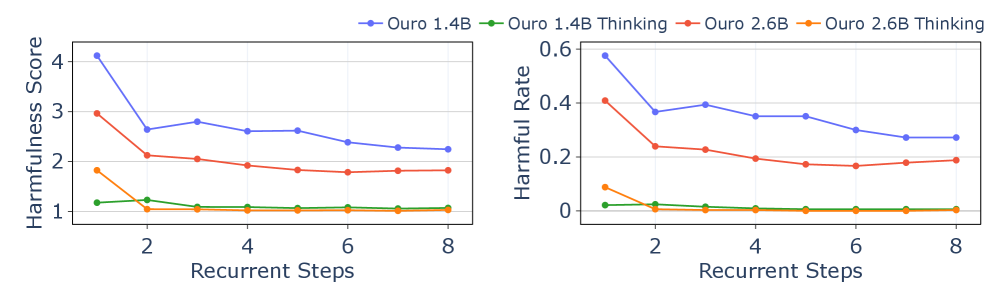
## Charts: Harmfulness Evaluation of Language Models
### Overview
The image presents two line charts comparing the harmfulness of different language models (Ouro 1.4B, Ouro 1.4B Thinking, Ouro 2.6B, and Ouro 2.6B Thinking) as a function of recurrent steps. The left chart displays "Harmfulness Score", while the right chart shows "Harmful Rate". Both charts share the same x-axis: "Recurrent Steps".
### Components/Axes
* **X-axis (Both Charts):** "Recurrent Steps" - Scale ranges from approximately 1 to 8.
* **Y-axis (Left Chart):** "Harmfulness Score" - Scale ranges from approximately 0.8 to 4.2.
* **Y-axis (Right Chart):** "Harmful Rate" - Scale ranges from approximately 0 to 0.6.
* **Legend (Top-Right of both charts):**
* Blue Line: "Ouro 1.4B"
* Red Line: "Ouro 1.4B Thinking"
* Orange Line: "Ouro 2.6B"
* Green Line: "Ouro 2.6B Thinking"
### Detailed Analysis or Content Details
**Left Chart: Harmfulness Score**
* **Ouro 1.4B (Blue Line):** Starts at approximately 3.6 at Recurrent Step 1, decreases to approximately 2.3 at Recurrent Step 8. The line generally slopes downward, with some fluctuations.
* **Ouro 1.4B Thinking (Red Line):** Starts at approximately 2.2 at Recurrent Step 1, decreases to approximately 1.8 at Recurrent Step 8. The line also slopes downward, but is less pronounced than the blue line.
* **Ouro 2.6B (Orange Line):** Starts at approximately 1.6 at Recurrent Step 1, increases slightly to approximately 1.9 at Recurrent Step 4, then decreases to approximately 1.7 at Recurrent Step 8. The line shows a slight initial increase followed by a decrease.
* **Ouro 2.6B Thinking (Green Line):** Remains relatively stable around approximately 1.1 throughout all recurrent steps, with minor fluctuations.
**Right Chart: Harmful Rate**
* **Ouro 1.4B (Blue Line):** Starts at approximately 0.42 at Recurrent Step 1, decreases to approximately 0.25 at Recurrent Step 8. The line slopes downward.
* **Ouro 1.4B Thinking (Red Line):** Starts at approximately 0.25 at Recurrent Step 1, decreases to approximately 0.18 at Recurrent Step 8. The line slopes downward.
* **Ouro 2.6B (Orange Line):** Starts at approximately 0.08 at Recurrent Step 1, increases to approximately 0.12 at Recurrent Step 4, then decreases to approximately 0.09 at Recurrent Step 8. The line shows a slight initial increase followed by a decrease.
* **Ouro 2.6B Thinking (Green Line):** Remains relatively stable around approximately 0.02 throughout all recurrent steps, with minor fluctuations.
### Key Observations
* Both charts show a general trend of decreasing harmfulness (both score and rate) as the number of recurrent steps increases for all models.
* Ouro 1.4B consistently exhibits the highest harmfulness score and rate, followed by Ouro 1.4B Thinking.
* Ouro 2.6B and Ouro 2.6B Thinking consistently exhibit the lowest harmfulness score and rate.
* The "Thinking" versions of the models (1.4B Thinking and 2.6B Thinking) consistently demonstrate lower harmfulness compared to their non-"Thinking" counterparts.
* The 2.6B models show less variation in harmfulness across recurrent steps compared to the 1.4B models.
### Interpretation
The data suggests that increasing the number of recurrent steps in these language models generally reduces their propensity to generate harmful content. This could be due to the models becoming more coherent and less likely to produce nonsensical or malicious outputs with more processing. The "Thinking" versions of the models, which likely incorporate additional safety mechanisms or training data, consistently exhibit lower harmfulness, indicating the effectiveness of these interventions. The relatively stable performance of the 2.6B models across recurrent steps suggests they are more robust and less sensitive to the number of processing steps. The initial slight increase in harmfulness for the 2.6B models at step 4 could be a temporary fluctuation or an artifact of the evaluation process. Overall, the charts demonstrate a clear relationship between model architecture, processing steps, and the generation of harmful content, highlighting the importance of both model size and iterative refinement in mitigating potential risks.