## Line Chart: Optimal Epsilon vs. Alpha
### Overview
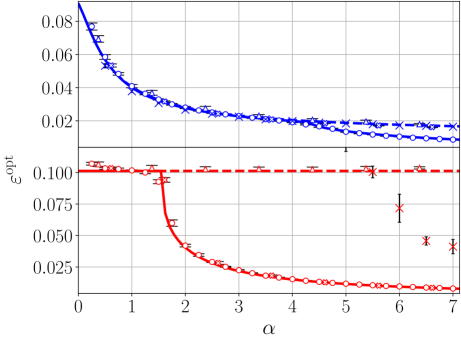
The image is a line chart displaying the relationship between "alpha" (α) on the x-axis and "epsilon optimal" (εopt) on the y-axis. There are two distinct data series plotted, one in blue and one in red, each with different markers and line styles. Error bars are present on some data points.
### Components/Axes
* **X-axis:** Labeled "α" (alpha), ranging from 0 to 7, with tick marks at each integer value.
* **Y-axis:** Labeled "εopt" (epsilon optimal), ranging from 0.02 to 0.10. Tick marks are present at 0.02, 0.04, 0.06, 0.08, 0.025, 0.050, 0.075, and 0.100.
* **Data Series 1 (Blue):** A solid blue line with circular markers. A dashed blue line with 'x' markers is also present, closely following the solid line.
* **Data Series 2 (Red):** A solid red line with circular markers. A dashed red line with triangle markers is also present, closely following the solid line.
* **Error Bars:** Vertical error bars are present on some data points for both series.
### Detailed Analysis
* **Blue Series (Solid Line, Circles):**
* Trend: Decreases rapidly from α = 0 to α = 2, then plateaus and remains relatively constant.
* Data Points:
* α = 0: εopt ≈ 0.08
* α = 1: εopt ≈ 0.04
* α = 2: εopt ≈ 0.025
* α = 7: εopt ≈ 0.018
* **Blue Series (Dashed Line, Xs):**
* Trend: Similar to the solid blue line, decreasing rapidly and then plateauing.
* Data Points: Follows the solid blue line closely, with values very similar to the solid line.
* **Red Series (Solid Line, Circles):**
* Trend: Starts relatively constant at α = 0, then decreases rapidly around α = 1.5, and plateaus at a low value.
* Data Points:
* α = 0: εopt ≈ 0.102
* α = 1: εopt ≈ 0.100
* α = 2: εopt ≈ 0.04
* α = 3: εopt ≈ 0.02
* α = 7: εopt ≈ 0.01
* **Red Series (Dashed Line, Triangles):**
* Trend: Remains relatively constant around εopt = 0.10.
* Data Points:
* α = 0 to α = 7: εopt ≈ 0.10
* **Error Bars:**
* Present on some data points, indicating the uncertainty in the measurements. The error bars appear to be larger for the red series at higher alpha values (α = 6 and α = 7).
### Key Observations
* The blue series (both solid and dashed) shows a rapid decrease in εopt as α increases from 0 to 2, after which it stabilizes.
* The red series (solid line) shows a sharp drop in εopt around α = 1.5, while the dashed red line remains constant.
* The error bars suggest that the uncertainty in the measurements increases for the red series at higher values of α.
### Interpretation
The chart illustrates how the optimal epsilon value (εopt) changes with respect to alpha (α) for two different scenarios represented by the blue and red series. The blue series indicates a system where the optimal epsilon quickly decreases as alpha increases, suggesting that a smaller epsilon is needed for optimal performance at higher alpha values. The red series, particularly the solid line, shows a critical point around α = 1.5, where the optimal epsilon drops significantly. This could indicate a phase transition or a change in the system's behavior. The dashed red line represents a scenario where the optimal epsilon remains constant regardless of the alpha value. The increasing error bars for the red series at higher alpha values suggest that the system becomes less stable or more sensitive to variations at these points.