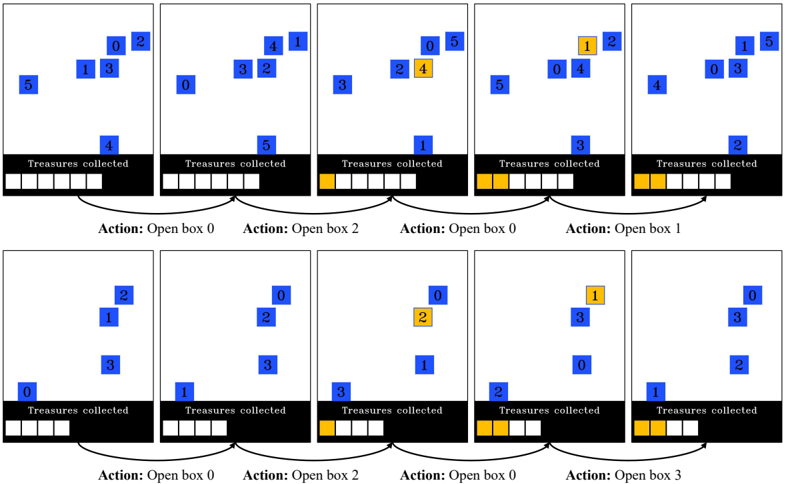
## Diagram: Treasure Collection Simulation
### Overview
The image depicts a simulation of treasure collection, visualized across ten separate frames arranged in two rows of five. Each frame shows a set of blue squares labeled with numbers, representing potential treasure locations, and a black bar at the bottom indicating the number of treasures collected. When a treasure is collected, the corresponding square turns yellow. The action taken in each frame (opening a specific box) is labeled below each frame.
### Components/Axes
* **Frames:** Ten individual frames showing the state of the treasure collection process at different steps.
* **Blue Squares:** Represent potential treasure locations, labeled with numbers from 0 to 5.
* **Yellow Squares:** Indicate collected treasures.
* **Black Bar:** Represents the "Treasures collected," with white squares indicating uncollected treasures and yellow squares indicating collected treasures.
* **Action Labels:** Text labels below each frame indicating the action taken (e.g., "Action: Open box 0").
### Detailed Analysis
**Row 1:**
* **Frame 1:**
* Blue squares labeled 0, 1, 2, 3, 4, and 5.
* "Treasures collected": 0 (all squares in the black bar are white).
* Action: Open box 0.
* **Frame 2:**
* Blue squares labeled 0, 1, 2, 3, 4.
* "Treasures collected": 0 (all squares in the black bar are white).
* Action: Open box 2.
* **Frame 3:**
* Blue squares labeled 0, 1, 3, 4, 5. Square 2 is now yellow.
* "Treasures collected": 1 (one yellow square in the black bar).
* Action: Open box 0.
* **Frame 4:**
* Blue squares labeled 0, 1, 2, 4, 5. Square 0 is now yellow.
* "Treasures collected": 2 (two yellow squares in the black bar).
* Action: Open box 1.
* **Frame 5:**
* Blue squares labeled 0, 1, 3, 4, 5. Square 1 is now yellow.
* "Treasures collected": 3 (three yellow squares in the black bar).
**Row 2:**
* **Frame 6:**
* Blue squares labeled 0, 1, 2, 3.
* "Treasures collected": 3 (three yellow squares in the black bar).
* Action: Open box 0.
* **Frame 7:**
* Blue squares labeled 0, 1, 2, 3.
* "Treasures collected": 3 (three yellow squares in the black bar).
* Action: Open box 2.
* **Frame 8:**
* Blue squares labeled 0, 1, 2, 3. Square 2 is now yellow.
* "Treasures collected": 4 (four yellow squares in the black bar).
* Action: Open box 0.
* **Frame 9:**
* Blue squares labeled 0, 1, 3. Square 0 is now yellow.
* "Treasures collected": 5 (five yellow squares in the black bar).
* Action: Open box 3.
* **Frame 10:**
* Blue squares labeled 0, 1, 2, 3. Square 3 is now yellow.
* "Treasures collected": 6 (six yellow squares in the black bar).
### Key Observations
* The simulation progresses by opening boxes, which may or may not contain a treasure.
* When a treasure is found, the corresponding square turns yellow, and the "Treasures collected" count increases.
* The actions taken are not necessarily sequential (e.g., opening box 0 multiple times).
* The number of potential treasure locations varies slightly between frames.
### Interpretation
The diagram illustrates a simple treasure collection simulation, likely used to demonstrate a reinforcement learning or decision-making process. The agent (or algorithm) takes actions (opening boxes) and receives rewards (collecting treasures). The goal is likely to learn an optimal strategy for maximizing the number of treasures collected. The varying number of potential treasure locations and the non-sequential actions suggest a dynamic and potentially stochastic environment. The simulation demonstrates how actions lead to changes in the state of the environment (treasure locations and collected treasures) and how these changes can be tracked and visualized.