\n
## Diagram: Treasure Collection Simulation
### Overview
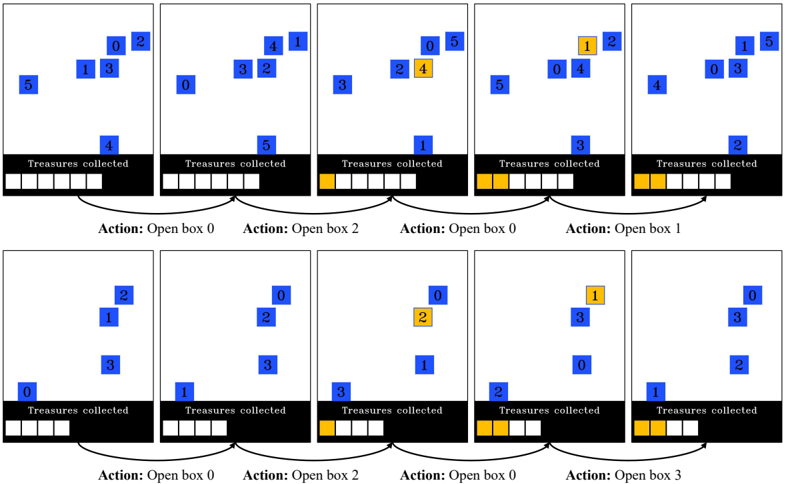
The image presents a series of diagrams illustrating a treasure collection simulation. Each diagram depicts a 2D space with numbered "boxes" (represented by blue squares) containing treasures. Below each diagram is a bar chart representing the "Treasures collected" and an action taken ("Action: Open box X"). The diagrams show the state of treasure distribution after a specific box is opened.
### Components/Axes
The diagrams consist of:
* **Boxes:** Blue squares numbered 0-5, representing containers with treasures.
* **Treasures:** Numbers within the boxes, indicating the number of treasures contained.
* **Action Label:** Text below each diagram indicating which box was opened (e.g., "Action: Open box 0").
* **Treasures Collected Bar Chart:** A bar chart with black and yellow segments, representing the total treasures collected. The length of the bar corresponds to the total number of treasures collected.
### Detailed Analysis or Content Details
The image contains six diagrams arranged in two rows of three. Each diagram represents a step in the simulation.
**Row 1:**
1. **Diagram 1:**
* Box 0: 2 treasures
* Box 1: 3 treasures
* Box 2: 0 treasures
* Box 3: 5 treasures
* Treasures Collected: 4 (black segment)
2. **Diagram 2:**
* Box 0: 3 treasures
* Box 1: 2 treasures
* Box 2: 4 treasures
* Box 3: 1 treasures
* Treasures Collected: 5 (black segment)
3. **Diagram 3:**
* Box 0: 2 treasures
* Box 1: 5 treasures
* Box 2: 4 treasures
* Box 3: 1 treasures
* Treasures Collected: 1 (black segment)
**Row 2:**
4. **Diagram 4:**
* Box 0: 1 treasures
* Box 1: 2 treasures
* Box 2: 0 treasures
* Box 3: 3 treasures
* Treasures Collected: 3 (black segment)
5. **Diagram 5:**
* Box 0: 1 treasures
* Box 1: 5 treasures
* Box 2: 0 treasures
* Box 3: 2 treasures
* Treasures Collected: 2 (black segment)
6. **Diagram 6:**
* Box 0: 0 treasures
* Box 1: 1 treasures
* Box 2: 3 treasures
* Box 3: 0 treasures
* Treasures Collected: 1 (black segment)
### Key Observations
* The number of treasures in each box changes after an action is taken.
* The "Treasures collected" bar chart shows a varying amount of treasures collected at each step.
* The action taken (opening a specific box) seems to influence the distribution of treasures across the boxes.
* The initial distribution of treasures is not uniform.
### Interpretation
The diagrams illustrate a simulation where treasures are distributed among boxes, and opening a box affects the treasure distribution. The simulation likely models a scenario where treasures can be moved or redistributed when a box is opened. The "Treasures collected" bar chart represents the cumulative number of treasures obtained up to that step. The simulation could be used to study strategies for maximizing treasure collection by choosing which boxes to open. The changing treasure counts within the boxes suggest a dynamic system where opening one box can influence the contents of others. The black and yellow segments in the bar chart likely represent treasures collected before and after the action, respectively. The simulation appears to be exploring the impact of sequential actions on a treasure distribution system.