## Multi-Panel Screenshot: Code, Flowchart, and Text
### Overview
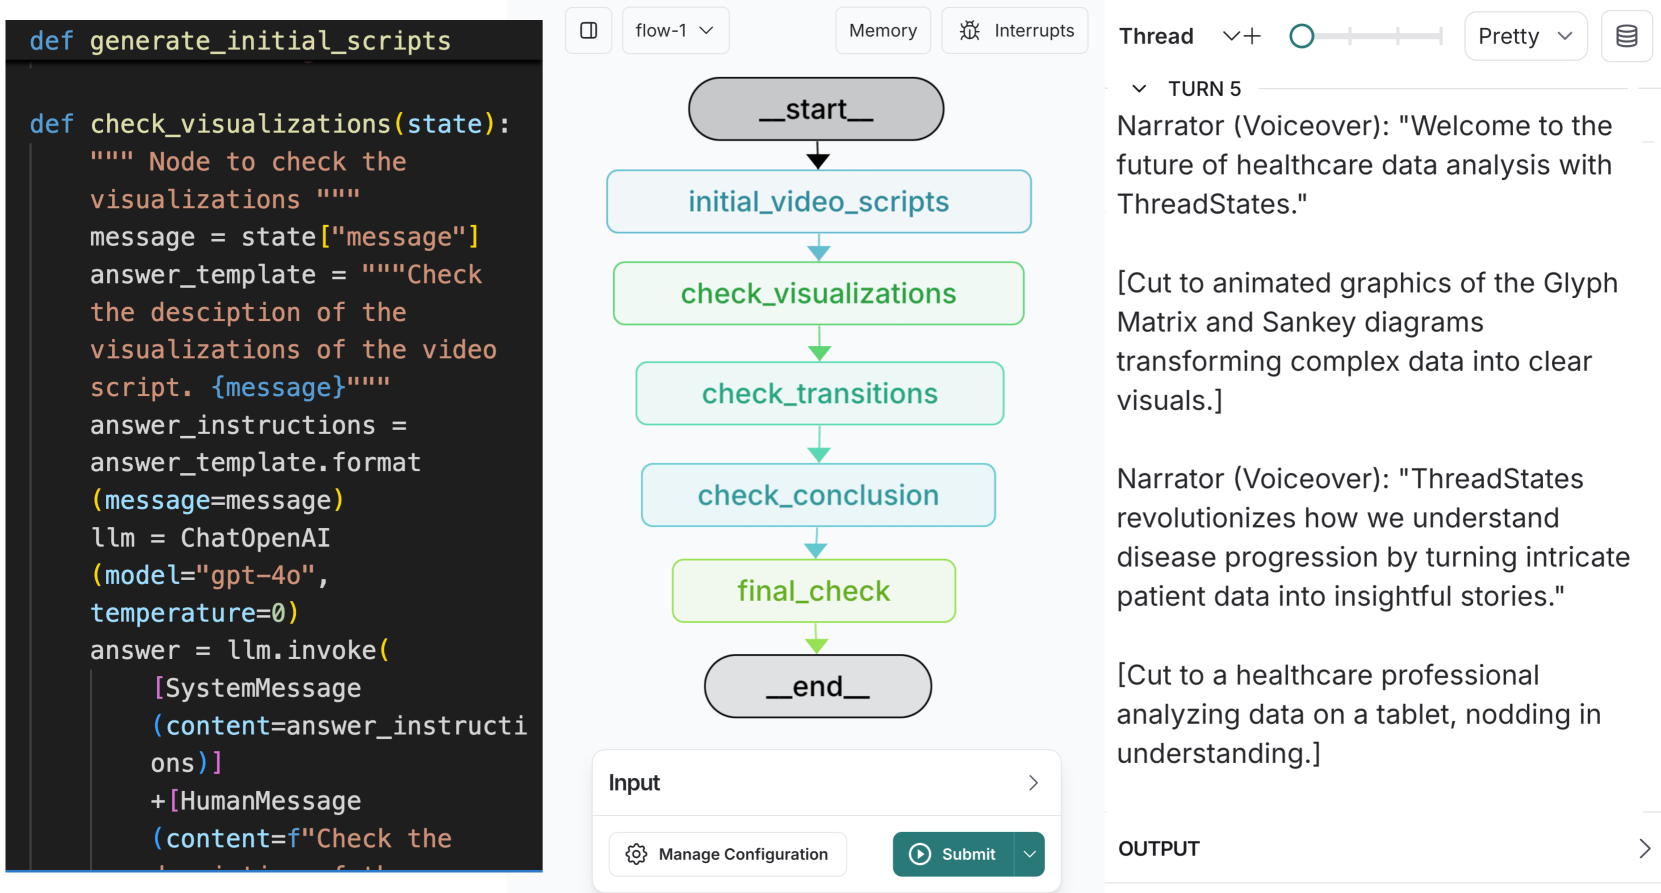
The image is a multi-panel screenshot showing three distinct sections: a code snippet, a flowchart, and a block of text. The code defines functions related to checking visualizations. The flowchart illustrates a process with steps like "check_visualizations" and "check_transitions." The text presents a narrative about healthcare data analysis using "ThreadStates."
### Components/Axes
**Panel 1: Code Snippet**
* Function definition: `def generate_initial_scripts`
* Function definition: `def check_visualizations(state):`
* Docstring: `""" Node to check the visualizations """`
* `message = state["message"]`
* `answer_template = """Check the desciption of the visualizations of the video script. {message}"""`
* `answer_instructions = answer_template.format(message=message)`
* `llm = ChatOpenAI(model="gpt-40", temperature=0)`
* `answer = llm.invoke([SystemMessage(content=answer_instructions)] + [HumanMessage(content=f"Check the...")`
**Panel 2: Flowchart**
* Title: `flow-1`
* Nodes (in order):
* `_start_` (Rounded rectangle, gray)
* `initial_video_scripts` (Rectangle, light blue)
* `check_visualizations` (Rectangle, light green)
* `check_transitions` (Rectangle, light blue)
* `check_conclusion` (Rectangle, light blue)
* `final_check` (Rectangle, light green)
* `_end_` (Rounded rectangle, gray)
* Arrows: Representing flow direction from top to bottom.
* Input section:
* Label: `Input`
* Button: `Manage Configuration`
* Button: `Submit`
**Panel 3: Text Narrative**
* Header: `Thread`
* Subheader: `TURN 5`
* Narrator (Voiceover): "Welcome to the future of healthcare data analysis with ThreadStates."
* [Cut to animated graphics of the Glyph Matrix and Sankey diagrams transforming complex data into clear visuals.]
* Narrator (Voiceover): "ThreadStates revolutionizes how we understand disease progression by turning intricate patient data into insightful stories."
* [Cut to a healthcare professional analyzing data on a tablet, nodding in understanding.]
* Output section:
* Label: `OUTPUT`
### Detailed Analysis or ### Content Details
**Code Snippet:**
The code defines two functions. The `check_visualizations` function takes a `state` as input, extracts a `message` from it, and uses it to format an `answer_template`. It then uses a `ChatOpenAI` model to generate an answer based on the formatted instructions.
**Flowchart:**
The flowchart illustrates a sequential process. It starts with `_start_`, proceeds through steps involving initial video scripts, checking visualizations, transitions, and conclusions, performs a final check, and ends with `_end_`.
**Text Narrative:**
The text describes "ThreadStates" as a tool for healthcare data analysis, specifically for understanding disease progression. It mentions the use of Glyph Matrix and Sankey diagrams for visualization.
### Key Observations
* The code snippet seems to be related to the flowchart, as the `check_visualizations` function corresponds to a step in the flowchart.
* The text narrative promotes "ThreadStates" as a revolutionary tool for healthcare data analysis.
* The flowchart provides a high-level overview of a process, while the code snippet provides a more detailed implementation of one of the steps.
### Interpretation
The image presents a cohesive narrative about using AI and data visualization techniques (ThreadStates, Glyph Matrix, Sankey diagrams) for healthcare data analysis. The code snippet shows a function that likely automates part of the process described in the flowchart. The text narrative positions "ThreadStates" as a key technology for understanding disease progression. The combination of code, flowchart, and narrative suggests a system designed to automate and enhance the analysis of healthcare data.