## Scatter Plot: college_biology
### Overview
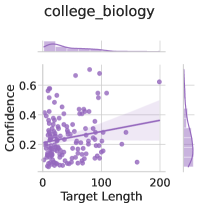
The image is a scatter plot titled "college_biology". It displays the relationship between "Target Length" on the x-axis and "Confidence" on the y-axis. The plot includes a regression line with a confidence interval shaded around it. Histograms are displayed along the top and right edges, showing the distributions of Target Length and Confidence, respectively.
### Components/Axes
* **Title:** college_biology
* **X-axis:** Target Length
* Scale ranges from 0 to 200, with tick marks at approximately 0, 100, and 200.
* **Y-axis:** Confidence
* Scale ranges from 0 to 0.6, with tick marks at approximately 0, 0.2, 0.4, and 0.6.
* **Data Points:** Each data point is represented by a purple circle.
* **Regression Line:** A purple line shows the linear regression fit to the data.
* **Confidence Interval:** A shaded purple region around the regression line represents the confidence interval.
* **Marginal Histograms:**
* Top: Histogram of Target Length distribution.
* Right: Histogram of Confidence distribution.
### Detailed Analysis
* **Data Points:** The data points are scattered across the plot. Most points are concentrated at lower Target Length values (0-50) and lower Confidence values (0-0.3).
* **Regression Line:** The regression line has a slight positive slope, indicating a weak positive correlation between Target Length and Confidence.
* **Confidence Interval:** The confidence interval widens as Target Length increases, suggesting greater uncertainty in the regression fit for larger Target Length values.
* **Target Length Distribution:** The histogram on top shows that the Target Length values are skewed towards lower values, with a peak around 0-25.
* **Confidence Distribution:** The histogram on the right shows that the Confidence values are also skewed towards lower values, with a peak around 0.1-0.2.
### Key Observations
* There is a weak positive correlation between Target Length and Confidence.
* Most data points are clustered at lower Target Length and Confidence values.
* The distributions of both Target Length and Confidence are skewed towards lower values.
### Interpretation
The scatter plot suggests that, in the context of "college_biology", there is a slight tendency for Confidence to increase as Target Length increases, but the relationship is weak. The concentration of data points at lower values indicates that most observations involve shorter target lengths and lower confidence levels. The skewed distributions of both variables further support this observation. The widening confidence interval at higher Target Length values suggests that the relationship between Target Length and Confidence is less reliable for larger target lengths.