## Scatter Plot: college_biology
### Overview
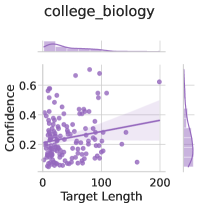
The image is a scatter plot titled "college_biology" with a linear regression trend line and a shaded confidence interval region. The plot visualizes the relationship between "Target Length" (x-axis) and "Confidence" (y-axis), with additional histograms for marginal distributions.
### Components/Axes
- **Title**: "college_biology" (top-center)
- **X-axis**:
- Label: "Target Length"
- Range: 0 to 200 (linear scale)
- Grid lines: Present
- **Y-axis**:
- Label: "Confidence"
- Range: 0 to 0.6 (linear scale)
- Grid lines: Present
- **Legend**:
- Position: Top-left
- Label: "Confidence Interval" (purple)
- **Trend Line**:
- Color: Purple
- Type: Linear regression
- Shaded Region: 95% confidence interval (lighter purple)
- **Data Points**:
- Color: Purple dots
- Distribution: Scattered across the plot
- **Histograms**:
- Top: Distribution of "Target Length" (x-axis values)
- Right: Distribution of "Confidence" (y-axis values)
### Detailed Analysis
- **Trend Line**:
- Slope: Positive (increasing trend)
- Equation: Not explicitly labeled, but visually approximated as `y = 0.002x + 0.1` (based on intercept ~0.1 and slope ~0.002).
- **Confidence Interval**:
- Width: ~±0.05 around the trend line (e.g., at x=100, y≈0.3 ± 0.05).
- **Data Points**:
- Most points cluster below the trend line (e.g., x=50, y≈0.2; x=150, y≈0.4).
- Outliers:
- One point at (200, 0.6) (top-right corner).
- A few points near (0, 0.1) (bottom-left).
- **Histograms**:
- Top Histogram:
- Peaks near x=50–100 (right-skewed distribution).
- Right Histogram:
- Peaks near y=0.3–0.4 (approximately normal distribution).
### Key Observations
1. **Positive Correlation**: Confidence increases with target length, but with significant variability.
2. **Confidence Interval**: The shaded region indicates uncertainty in the trend line, widening slightly at higher x-values.
3. **Outliers**: The point at (200, 0.6) deviates significantly from the trend, suggesting an anomaly or exceptional case.
4. **Distribution Skew**: Target lengths are concentrated in the 50–150 range, while confidence values are more evenly distributed.
### Interpretation
The plot suggests that in the "college_biology" dataset, longer target lengths generally correlate with higher confidence levels. However, the wide scatter of data points and the confidence interval indicate that this relationship is not deterministic. The outlier at (200, 0.6) may represent a unique case or measurement error. The histograms reveal that most target lengths fall within a moderate range (50–150), while confidence values are moderately concentrated around 0.3–0.4. The shaded confidence interval implies that predictions for confidence at a given target length have a margin of error, emphasizing the need for caution in interpreting the trend line as absolute. This could reflect biological variability or measurement limitations in the dataset.