# Technical Document Extraction: Heatmap Analysis
## 1. Axis Labels and Markers
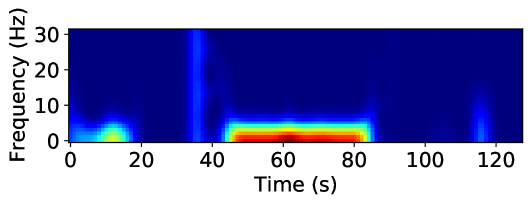
- **X-Axis**:
- Title: `Time (s)`
- Range: `0` to `120` seconds
- Increment: `20` second intervals
- **Y-Axis**:
- Title: `Frequency (Hz)`
- Range: `0` to `30` Hz
- Increment: `10` Hz intervals
## 2. Color Gradient and Intensity
- **Color Scale**:
- Dark blue → Red (low to high intensity)
- No explicit legend present; inferred from gradient.
- **Key Observations**:
- Red regions indicate peak intensity (highest energy/activity).
- Blue regions indicate low/no activity.
## 3. Temporal and Frequency Trends
### Vertical Activity Peaks
1. **20s**:
- Narrow vertical blue line at ~5 Hz.
2. **40s**:
- Tall vertical blue line spanning ~10–30 Hz.
3. **60–80s**:
- Broad horizontal red band (~5–10 Hz) with localized intensity spikes.
4. **120s**:
- Narrow vertical blue line at ~15 Hz.
### Background Activity
- **0–20s**:
- Low-intensity blue background with faint yellow-green gradient near 0 Hz.
- **80–120s**:
- Predominantly dark blue with sparse activity.
## 4. Spatial Grounding and Component Isolation
- **Main Chart**:
- Entire heatmap occupies the image.
- **No Header/Footer/Text Blocks**:
- No embedded text, legends, or annotations.
## 5. Trend Verification
- **60–80s Red Band**:
- Sustained high-intensity activity (~5–10 Hz) with localized peaks (red cores).
- **40s Blue Line**:
- Sharp vertical spike across frequency range (10–30 Hz).
- **20s and 120s**:
- Isolated narrow spikes at specific frequencies.
## 6. Data Table Reconstruction
- **No Explicit Data Table Present**:
- Information inferred from heatmap intensity and spatial distribution.
## 7. Cross-Reference Validation
- **Color Consistency**:
- Red = highest intensity (confirmed by 60–80s band).
- Blue = low/no activity (confirmed by background and isolated spikes).
## 8. Language and Textual Content
- **Language**: English (all labels and axis titles).
- **Transcribed Text**:
- `Time (s)`, `Frequency (Hz)`
## 9. Summary of Key Data Points
| Time (s) | Frequency (Hz) | Intensity (Color) |
|----------|----------------|-------------------|
| 20 | ~5 | Blue |
| 40 | 10–30 | Blue |
| 60–80 | 5–10 | Red |
| 120 | ~15 | Blue |
## 10. Conclusion
The heatmap depicts transient frequency-domain activity over 120 seconds, with dominant energy concentrated at 60–80s (5–10 Hz) and secondary spikes at 20s, 40s, and 120s. No explicit legend or textual annotations are present; interpretation relies on color gradient and spatial distribution.