## Coalition Formation and Performance Analysis
### Overview
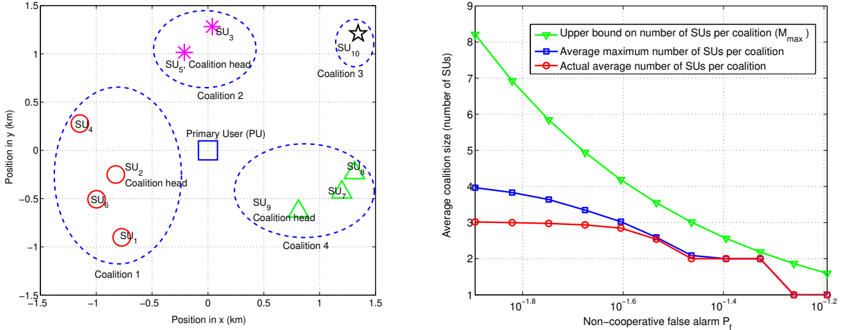
The image presents two plots. The left plot shows a spatial distribution of users (SUs) and a primary user (PU) grouped into coalitions. The right plot shows the relationship between the non-cooperative false alarm probability (Pf) and the average coalition size, with three data series: upper bound, average maximum, and actual average number of SUs per coalition.
### Components/Axes
**Left Plot (Spatial Distribution):**
* **X-axis:** Position in x (km), ranging from -1.5 to 1.5 with gridlines at -1, -0.5, 0, 0.5, 1.
* **Y-axis:** Position in y (km), ranging from -1.5 to 1.5 with gridlines at -1, -0.5, 0, 0.5, 1.
* **Elements:**
* SUs: Represented by different shapes (circles, stars, triangles) and labeled SU1 to SU10.
* Primary User (PU): Represented by a square.
* Coalitions: Indicated by dashed blue ellipses, labeled Coalition 1 to Coalition 4.
* Coalition Heads: Labeled next to specific SUs (SU2, SU5, SU9).
**Right Plot (Coalition Size vs. False Alarm Probability):**
* **X-axis:** Non-cooperative false alarm Pf, ranging from 10^-1.8 to 10^-1.2, logarithmically scaled.
* **Y-axis:** Average coalition size (number of SUs), ranging from 1 to 9.
* **Legend (Top-Right):**
* Green line with triangles: "Upper bound on number of SUs per coalition (Mmax)"
* Blue line with squares: "Average maximum number of SUs per coalition"
* Red line with circles: "Actual average number of SUs per coalition"
### Detailed Analysis
**Left Plot (Spatial Distribution):**
* **Coalition 1:** Contains SUs 1, 2 (Coalition head), 4, and 6. Located in the bottom-left quadrant.
* **Coalition 2:** Contains SUs 3 and 5 (Coalition head). Located in the top-center.
* **Coalition 3:** Contains SU 10. Located in the top-right.
* **Coalition 4:** Contains SUs 7, 8, and 9 (Coalition head). Located in the bottom-right.
* **Primary User (PU):** Located near the center, slightly to the right.
**Right Plot (Coalition Size vs. False Alarm Probability):**
* **Upper bound on number of SUs per coalition (Mmax) (Green):**
* Starts at approximately 8 for Pf = 10^-1.8.
* Decreases steadily to approximately 1.5 for Pf = 10^-1.2.
* Trend: Decreasing.
* **Average maximum number of SUs per coalition (Blue):**
* Starts at approximately 4 for Pf = 10^-1.8.
* Decreases to approximately 2 for Pf = 10^-1.4.
* Remains relatively constant at 2 for Pf between 10^-1.4 and 10^-1.2.
* Trend: Decreasing, then stabilizing.
* **Actual average number of SUs per coalition (Red):**
* Starts at approximately 3 for Pf = 10^-1.8.
* Decreases to approximately 2 for Pf = 10^-1.6.
* Remains relatively constant at 2 for Pf between 10^-1.6 and 10^-1.4.
* Drops sharply to approximately 0.5 for Pf = 10^-1.2.
* Trend: Decreasing, stabilizing, then sharply decreasing.
### Key Observations
* The spatial distribution shows how SUs are grouped into coalitions, with varying numbers of members.
* The average coalition size decreases as the non-cooperative false alarm probability increases.
* The upper bound on the number of SUs per coalition (Mmax) is consistently higher than the average maximum and actual average number of SUs.
* The actual average number of SUs per coalition experiences a sharp drop at higher false alarm probabilities.
### Interpretation
The plots illustrate the relationship between coalition formation, spatial distribution of users, and the impact of false alarm probability on coalition size. The spatial distribution shows the physical arrangement of users and how they are grouped into coalitions, likely based on proximity or communication capabilities. The right plot demonstrates that as the false alarm probability increases, the average coalition size decreases. This suggests that higher false alarm rates may discourage users from forming or maintaining coalitions, possibly due to increased uncertainty or unreliability in the network. The sharp drop in the actual average number of SUs at higher false alarm probabilities indicates a critical threshold where coalition formation becomes significantly less viable. The upper bound (Mmax) represents the theoretical maximum coalition size, while the average maximum and actual average reflect the practical limitations imposed by the false alarm probability.