## Diagram & Chart: Coalition Formation and Performance
### Overview
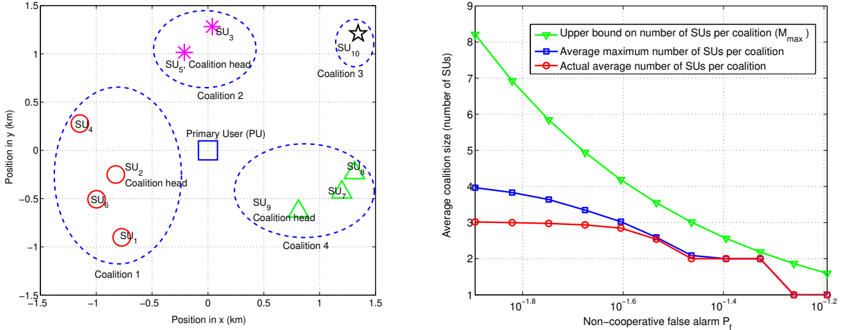
The image presents a combination of a diagram illustrating coalition formation among Sensor Units (SUs) and a chart depicting the relationship between non-cooperative false alarm probability and average coalition size. The diagram shows the spatial distribution of SUs, coalition heads, and a Primary User (PU). The chart plots three metrics related to coalition size against the non-cooperative false alarm probability.
### Components/Axes
**Diagram Components:**
* **Axes:** Position in x (km) and Position in y (km). The x and y axes range from -1.5 to 1.5 km.
* **Entities:**
* Primary User (PU): Represented by a blue square.
* Sensor Units (SU): Represented by colored circles (SU1, SU2, SU3, SU4, SU5, SU6, SU7, SU8, SU9, SU10).
* Coalition Heads: Represented by larger, open circles (SU2, SU6, SU3, SU7).
* Coalitions: Represented by dashed circles encompassing SUs. Coalition 1, Coalition 2, Coalition 3, Coalition 4 are labeled.
* **Labels:** "Primary User (PU)", "SU<sub>i</sub>", "Coalition head", "Coalition 1", "Coalition 2", "Coalition 3", "Coalition 4".
**Chart Components:**
* **X-axis:** Non-cooperative false alarm P<sub>f</sub>. Logarithmic scale from 10<sup>-18</sup> to 10<sup>-2</sup>.
* **Y-axis:** Average coalition size (number of SUs). Scale from 0 to 9.
* **Data Series:**
* Upper bound on number of SUs per coalition (M<sub>max</sub>): Green line.
* Average maximum number of SUs per coalition: Blue line with square markers.
* Actual average number of SUs per coalition: Red line with circle markers.
* **Legend:** Located in the top-right corner, associating colors with data series.
### Detailed Analysis or Content Details
**Diagram Analysis:**
* The Primary User (PU) is located near the origin (x ≈ 0, y ≈ 0).
* SU1 is located at approximately (-1.2, -1.3).
* SU2 (Coalition Head) is located at approximately (-0.3, -0.5).
* SU3 (Coalition Head) is located at approximately (0.7, 1.1).
* SU4 is located at approximately (-0.5, 0.5).
* SU5 is located at approximately (-1.0, -0.8).
* SU6 (Coalition Head) is located at approximately (-0.7, -1.0).
* SU7 (Coalition Head) is located at approximately (0.8, -0.8).
* SU8 is located at approximately (-0.2, -1.2).
* SU9 is located at approximately (1.0, 0.5).
* SU10 is located at approximately (1.2, 1.3).
* Coalition 1 encompasses SU1, SU5, and SU8.
* Coalition 2 encompasses SU2, SU4.
* Coalition 3 encompasses SU3, SU10.
* Coalition 4 encompasses SU6, SU7, SU9.
**Chart Analysis:**
* **Upper bound (Green Line):** Starts at approximately 8.5 at P<sub>f</sub> = 10<sup>-18</sup> and decreases monotonically to approximately 1.5 at P<sub>f</sub> = 10<sup>-2</sup>.
* **Average Maximum (Blue Line):** Starts at approximately 4.2 at P<sub>f</sub> = 10<sup>-18</sup> and decreases monotonically to approximately 1.8 at P<sub>f</sub> = 10<sup>-2</sup>.
* **Actual Average (Red Line):** Starts at approximately 3.5 at P<sub>f</sub> = 10<sup>-18</sup> and decreases monotonically to approximately 1.6 at P<sub>f</sub> = 10<sup>-2</sup>.
* All three lines exhibit a steep decline between P<sub>f</sub> = 10<sup>-18</sup> and P<sub>f</sub> = 10<sup>-16</sup>.
* The lines converge towards the lower end of the y-axis as P<sub>f</sub> increases.
### Key Observations
* The diagram illustrates a scenario where SUs form coalitions around coalition heads, potentially to improve sensing or communication capabilities.
* The chart demonstrates an inverse relationship between the non-cooperative false alarm probability and the average coalition size. As the false alarm probability increases, the average coalition size decreases.
* The upper bound on coalition size is consistently higher than the actual average coalition size.
* The average maximum number of SUs per coalition is consistently higher than the actual average number of SUs per coalition.
### Interpretation
The data suggests a trade-off between the accuracy of sensing (represented by the false alarm probability) and the efficiency of coalition formation (represented by the coalition size). When the false alarm probability is low (high accuracy), SUs tend to form larger coalitions, potentially to improve detection or coverage. However, as the false alarm probability increases (lower accuracy), SUs form smaller coalitions, possibly to reduce the impact of false positives.
The difference between the upper bound and the actual average coalition size indicates that there is potential for optimizing coalition formation to achieve larger coalition sizes without significantly increasing the false alarm probability. The convergence of the lines at higher false alarm probabilities suggests that beyond a certain point, increasing the false alarm probability does not lead to a significant reduction in coalition size.
The spatial distribution of SUs and coalitions in the diagram provides context for the chart data. The placement of the Primary User and the formation of coalitions around it suggest a scenario where the SUs are collaborating to monitor or protect the PU. The diagram and chart together provide a comprehensive view of the relationship between coalition formation, false alarm probability, and system performance.