## Bar Chart: Mean Accuracy and Macro Average After Internal Error Injection
### Overview
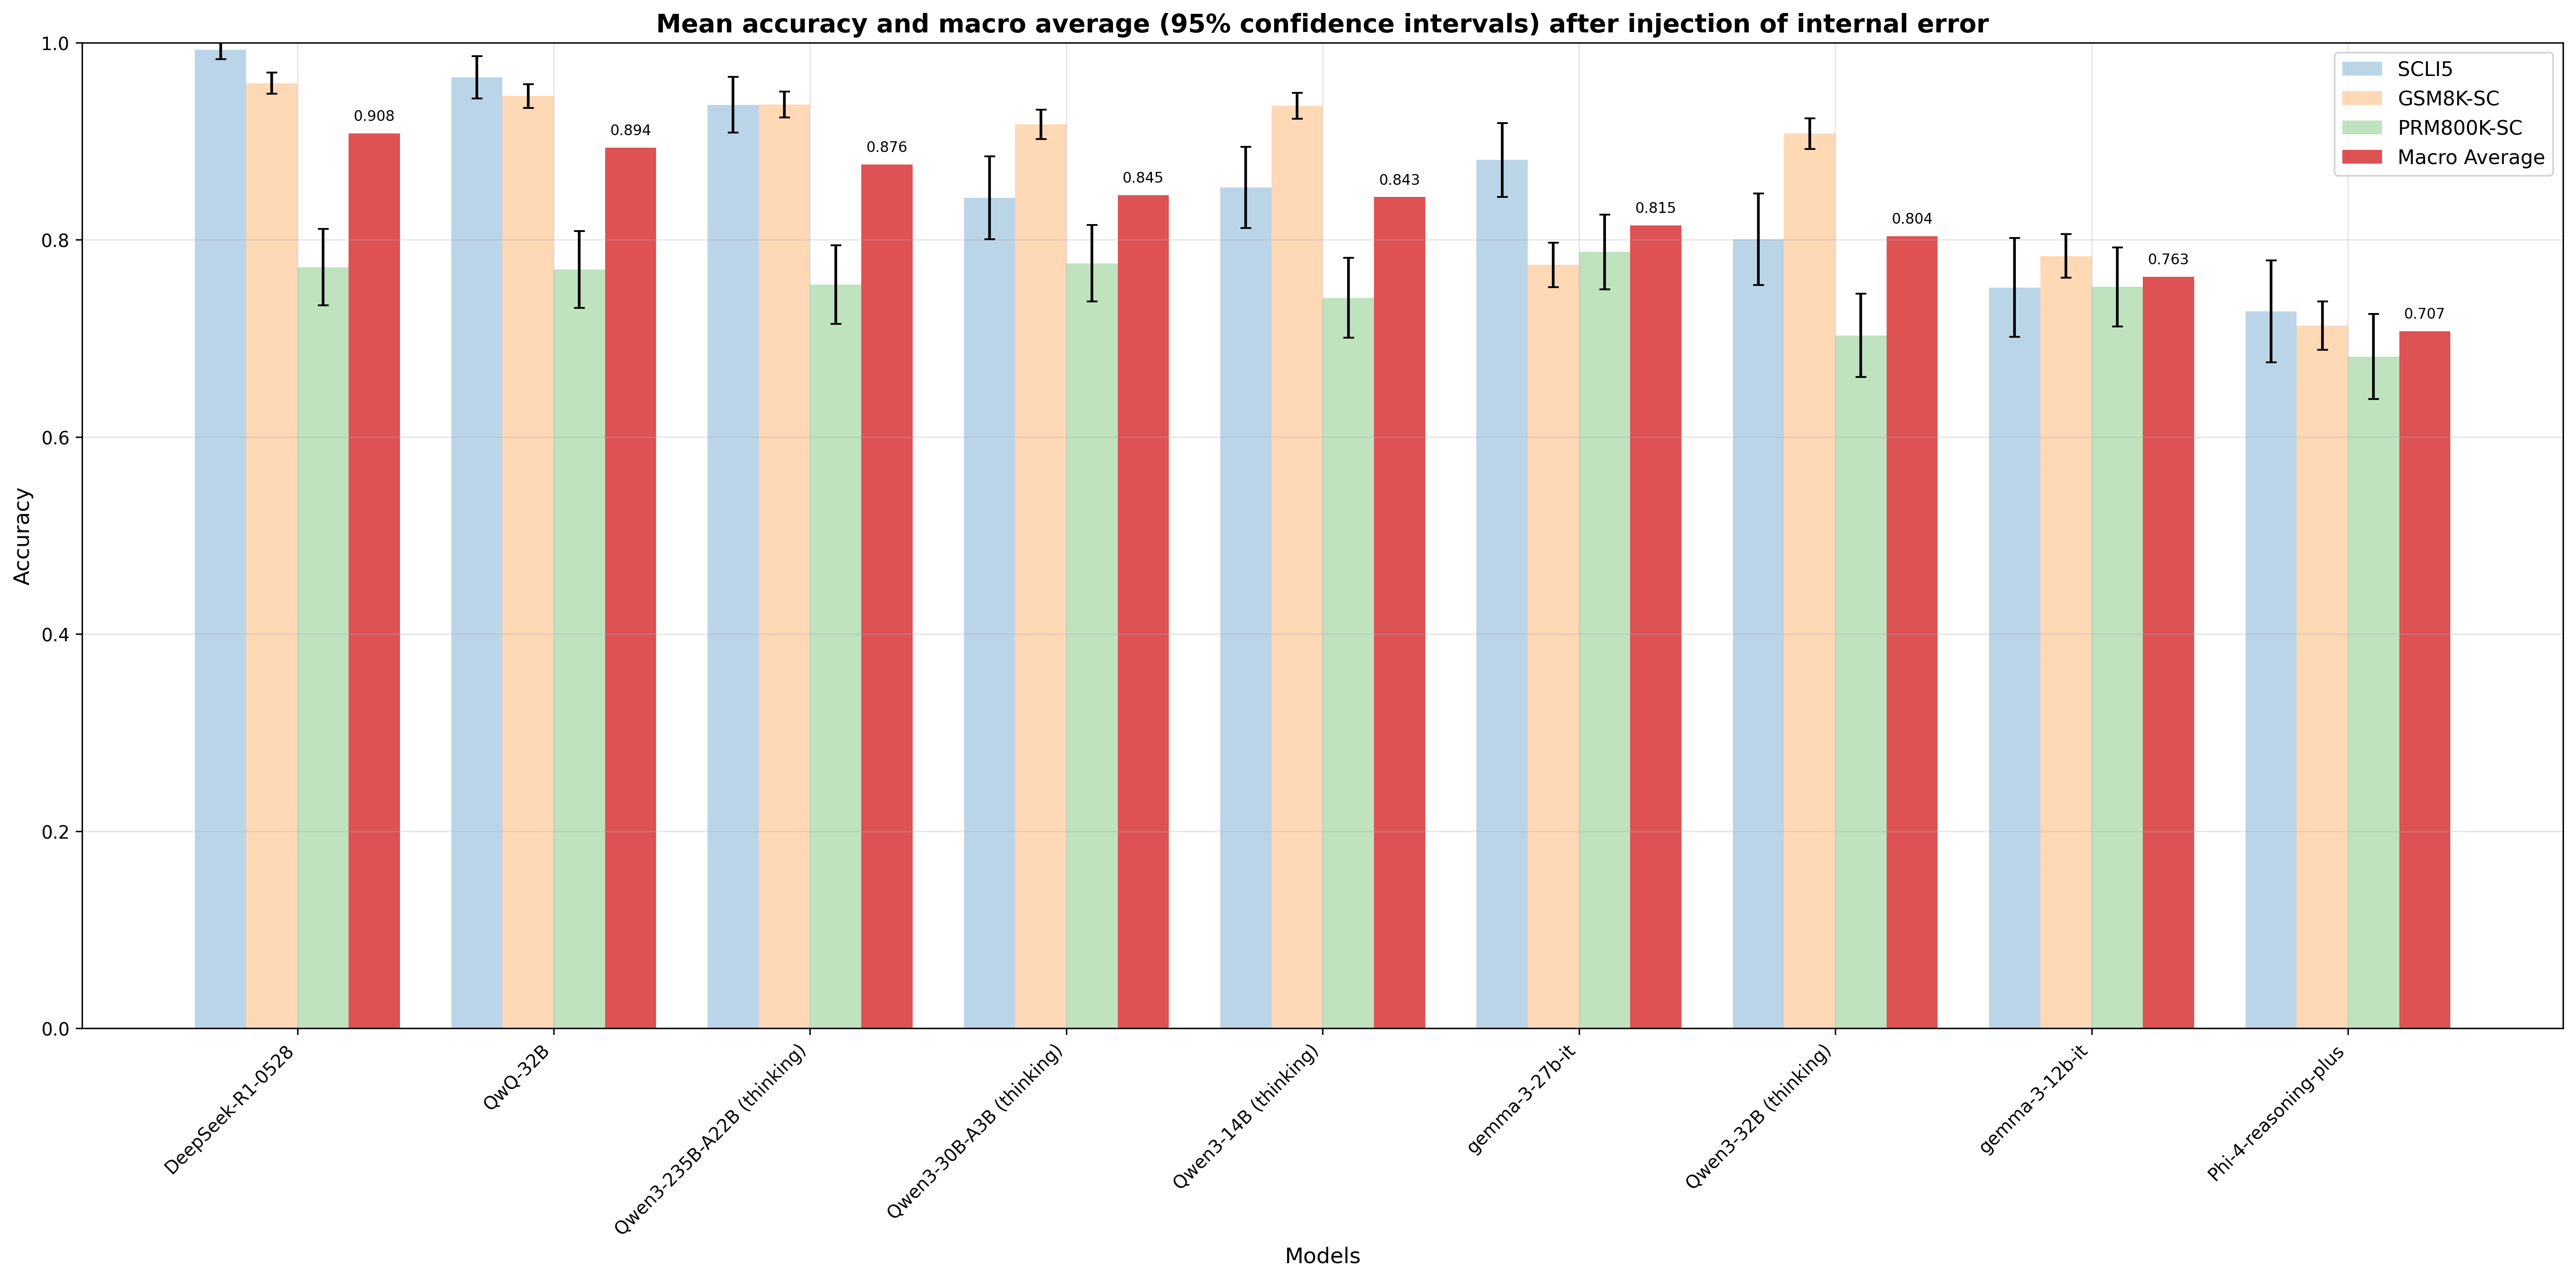
This is a grouped bar chart displaying the mean accuracy (with 95% confidence intervals) of nine different language models across three specific benchmarks and a macro average. The chart evaluates model performance after the injection of an internal error. The overall trend shows a general decrease in accuracy from left to right across the listed models.
### Components/Axes
* **Title:** "Mean accuracy and macro average (95% confidence intervals) after injection of internal error"
* **Y-Axis:** Labeled "Accuracy". Scale ranges from 0.0 to 1.0, with major gridlines at 0.2 intervals.
* **X-Axis:** Labeled "Models". Lists nine distinct model names, rotated for readability.
* **Legend:** Positioned in the top-right corner. Contains four categories with corresponding colors:
* **SCLI5:** Light blue bars.
* **GSM8K-SC:** Light orange/peach bars.
* **PRM800K-SC:** Light green bars.
* **Macro Average:** Red bars.
* **Data Representation:** Each model has a cluster of four bars (one for each legend category). Black error bars (I-beams) are present on each bar, representing the 95% confidence interval.
### Detailed Analysis
**Model-by-Model Data Extraction (Approximate Values):**
1. **DeepSeek-R1-0528**
* SCLI5: ~0.99 (Very high, small error bar)
* GSM8K-SC: ~0.96
* PRM800K-SC: ~0.77
* Macro Average: **0.908** (Explicitly labeled)
2. **QwQ-32B**
* SCLI5: ~0.97
* GSM8K-SC: ~0.95
* PRM800K-SC: ~0.77
* Macro Average: **0.894** (Explicitly labeled)
3. **Qwen3-235B-A22B (thinking)**
* SCLI5: ~0.94
* GSM8K-SC: ~0.94 (Nearly equal to SCLI5)
* PRM800K-SC: ~0.76
* Macro Average: **0.876** (Explicitly labeled)
4. **Qwen3-30B-A3B (thinking)**
* SCLI5: ~0.84
* GSM8K-SC: ~0.92 (Noticeably higher than SCLI5)
* PRM800K-SC: ~0.78
* Macro Average: **0.845** (Explicitly labeled)
5. **Qwen3-14B (thinking)**
* SCLI5: ~0.85
* GSM8K-SC: ~0.94 (Highest in this cluster)
* PRM800K-SC: ~0.74
* Macro Average: **0.843** (Explicitly labeled)
6. **gemma-3-27b-it**
* SCLI5: ~0.88 (Highest in this cluster)
* GSM8K-SC: ~0.78
* PRM800K-SC: ~0.79
* Macro Average: **0.815** (Explicitly labeled)
7. **Qwen3-32B (thinking)**
* SCLI5: ~0.80
* GSM8K-SC: ~0.91 (Significantly higher than SCLI5)
* PRM800K-SC: ~0.70
* Macro Average: **0.804** (Explicitly labeled)
8. **gemma-3-12b-it**
* SCLI5: ~0.75
* GSM8K-SC: ~0.79
* PRM800K-SC: ~0.75
* Macro Average: **0.763** (Explicitly labeled)
9. **Phi-4-reasoning-plus**
* SCLI5: ~0.73
* GSM8K-SC: ~0.71
* PRM800K-SC: ~0.68 (Lowest bar in the entire chart)
* Macro Average: **0.707** (Explicitly labeled)
### Key Observations
* **Benchmark Performance Hierarchy:** Across nearly all models, the **GSM8K-SC** (orange) and **SCLI5** (blue) benchmarks consistently yield higher accuracy scores than the **PRM800K-SC** (green) benchmark. PRM800K-SC is the lowest-performing benchmark for every model except `gemma-3-27b-it`, where it is marginally higher than GSM8K-SC.
* **Model Performance Trend:** There is a clear downward trend in the **Macro Average** (red bars) from left to right, starting at 0.908 for `DeepSeek-R1-0528` and ending at 0.707 for `Phi-4-reasoning-plus`. This suggests the models are ordered roughly from highest to lowest overall performance under the tested condition.
* **Variability in Benchmark Lead:** While SCLI5 is often the top or near-top performer (e.g., `DeepSeek-R1-0528`, `gemma-3-27b-it`), several "thinking" models from the Qwen3 series (`Qwen3-30B-A3B`, `Qwen3-14B`, `Qwen3-32B`) show a distinct pattern where **GSM8K-SC** accuracy significantly outperforms their SCLI5 accuracy.
* **Confidence Intervals:** The error bars (95% CI) are generally wider for the PRM800K-SC benchmark compared to the others, indicating greater variability or uncertainty in the results for that specific task. The Macro Average bars have moderate error bars.
### Interpretation
This chart provides a comparative analysis of model robustness or capability degradation following an internal error injection. The data suggests:
1. **Task-Dependent Resilience:** Models do not fail uniformly across different types of tasks. Their performance is highly dependent on the specific benchmark (SCLI5, GSM8K-SC, PRM800K-SC), indicating that the "internal error" impacts reasoning or knowledge recall in a task-specific manner. The consistently lower scores on PRM800K-SC might point to this benchmark being more sensitive to the injected error or testing a capability that is more fragile.
2. **Model Architecture/Training Implications:** The superior performance of models like `DeepSeek-R1-0528` and `QwQ-32B` on the macro average suggests they possess greater overall stability or error-correction mechanisms under the tested conditions. The reversal where GSM8K-SC outperforms SCLI5 in several Qwen3 models hints at a potential specialization or a different failure mode in their "thinking" variants.
3. **Benchmarking Insight:** The chart underscores the importance of using multiple, diverse benchmarks (like the three shown) to evaluate AI systems. Relying on a single metric (e.g., only GSM8K-SC) would paint an incomplete and potentially misleading picture of a model's post-error behavior. The macro average serves as a useful, but not sufficient, single summary statistic.
In essence, the visualization moves beyond simple accuracy reporting to reveal nuanced patterns of failure and resilience across different AI models and cognitive tasks when subjected to a controlled perturbation.