## Line Chart: Completeness vs. Samples for Two Parameter Sets
### Overview
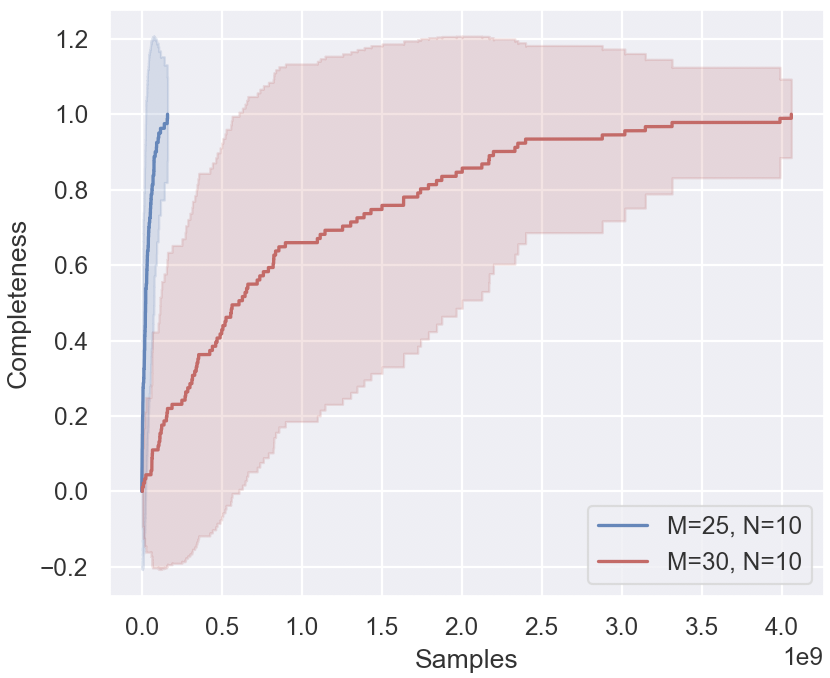
The image displays a line chart comparing the progression of a metric called "Completeness" over an increasing number of "Samples" for two different experimental configurations. Each configuration is represented by a central line (likely a mean or median) surrounded by a shaded region indicating variance, confidence intervals, or a range of outcomes.
### Components/Axes
* **Chart Type:** Line chart with shaded confidence/error bands.
* **X-Axis:**
* **Label:** "Samples"
* **Scale:** Linear scale.
* **Range:** 0.0 to 4.0 x 10⁹ (4 billion).
* **Major Tick Marks:** 0.0, 0.5, 1.0, 1.5, 2.0, 2.5, 3.0, 3.5, 4.0 (all multiplied by 1e9).
* **Y-Axis:**
* **Label:** "Completeness"
* **Scale:** Linear scale.
* **Range:** -0.2 to 1.2.
* **Major Tick Marks:** -0.2, 0.0, 0.2, 0.4, 0.6, 0.8, 1.0, 1.2.
* **Legend:**
* **Position:** Bottom-right corner of the plot area.
* **Entry 1:** A blue line labeled "M=25, N=10".
* **Entry 2:** A red line labeled "M=30, N=10".
### Detailed Analysis
**1. Data Series: M=25, N=10 (Blue Line & Shading)**
* **Trend Verification:** The blue line exhibits an extremely steep, near-vertical ascent from the origin, followed by a sharp knee and a flat plateau.
* **Data Points & Behavior:**
* Starts at approximately (0 samples, 0.0 completeness).
* Rises with extreme rapidity. By approximately 0.1 x 10⁹ (100 million) samples, the completeness value is already near 0.9.
* Reaches a plateau at a completeness value of approximately 0.95 to 1.0 by around 0.2 x 10⁹ (200 million) samples.
* The line remains flat at this high completeness level for the remainder of the x-axis range (up to 4.0e9 samples).
* **Shaded Region (Uncertainty):** The blue shaded area is very narrow, tightly hugging the central line. It suggests low variance or high confidence in the result for this configuration. The band spans roughly ±0.05 in completeness at its widest point near the plateau.
**2. Data Series: M=30, N=10 (Red Line & Shading)**
* **Trend Verification:** The red line shows a much more gradual, logarithmic-like growth curve. It rises steadily but at a significantly slower rate than the blue line.
* **Data Points & Behavior:**
* Starts at approximately (0 samples, 0.0 completeness).
* Shows a steady, concave-down increase. Key approximate milestones:
* ~0.5e9 samples: Completeness ≈ 0.35
* ~1.0e9 samples: Completeness ≈ 0.65
* ~2.0e9 samples: Completeness ≈ 0.85
* ~3.0e9 samples: Completeness ≈ 0.95
* ~4.0e9 samples: Completeness ≈ 0.98 (approaching 1.0).
* **Shaded Region (Uncertainty):** The red shaded area is very broad, indicating high variance or uncertainty in the outcomes for this configuration.
* The band is asymmetrical. The lower bound rises slowly, reaching ~0.8 completeness only near 4.0e9 samples.
* The upper bound rises more quickly, crossing 1.0 completeness around 1.5e9 samples and peaking near 1.2 before slightly declining.
* The width of the band suggests that individual runs with parameters M=30, N=10 can produce a wide range of completeness values for the same number of samples.
### Key Observations
1. **Dramatic Performance Difference:** The configuration with M=25 achieves near-maximal completeness orders of magnitude faster (in terms of samples) than the configuration with M=30. The blue line's plateau is reached before the red line has even achieved 0.4 completeness.
2. **Variance Disparity:** The M=25 configuration shows highly consistent, predictable results (narrow band). The M=30 configuration shows highly variable, unpredictable results (wide band).
3. **Asymptotic Behavior:** Both series appear to asymptotically approach a completeness value of 1.0, but at vastly different rates. The M=25 series effectively reaches this limit almost immediately on the chart's scale.
4. **Y-Axis Range:** The y-axis extends to -0.2 and 1.2, likely to fully contain the wide variance of the red (M=30) series, whose lower confidence bound dips slightly below 0.0 initially and whose upper bound exceeds 1.0.
### Interpretation
This chart likely illustrates a trade-off in a computational or sampling-based process (e.g., Monte Carlo simulation, optimization, machine learning training) governed by parameters M and N.
* **Parameter Impact:** The parameter M appears to have a critical, non-linear impact on **sample efficiency**. A lower M (25) leads to extremely fast convergence to high completeness. A higher M (30) drastically slows convergence and introduces significant uncertainty.
* **What "Completeness" Represents:** "Completeness" is a normalized metric (0 to 1) indicating how much of a solution, coverage, or target has been achieved. A value of 1.0 represents full completion.
* **Practical Implication:** If the goal is to achieve high completeness quickly (with fewer samples), the M=25, N=10 configuration is vastly superior. However, the high variance of the M=30 configuration suggests that while it is slower on average, some individual runs might achieve very high completeness (upper red band >1.0) earlier, though this comes with the risk of very poor performance (lower red band).
* **Underlying Mechanism:** The stark difference suggests M might control a complexity or dimensionality factor. A higher M could make the problem space much larger or more difficult to explore, requiring exponentially more samples for the same progress and leading to less predictable outcomes. The chart serves as a strong visual argument for selecting M=25 over M=30 for this particular process, assuming the goal is rapid and reliable convergence.