## Line Graph: Completeness vs. Samples (M=25,N=10 vs. M=30,N=10)
### Overview
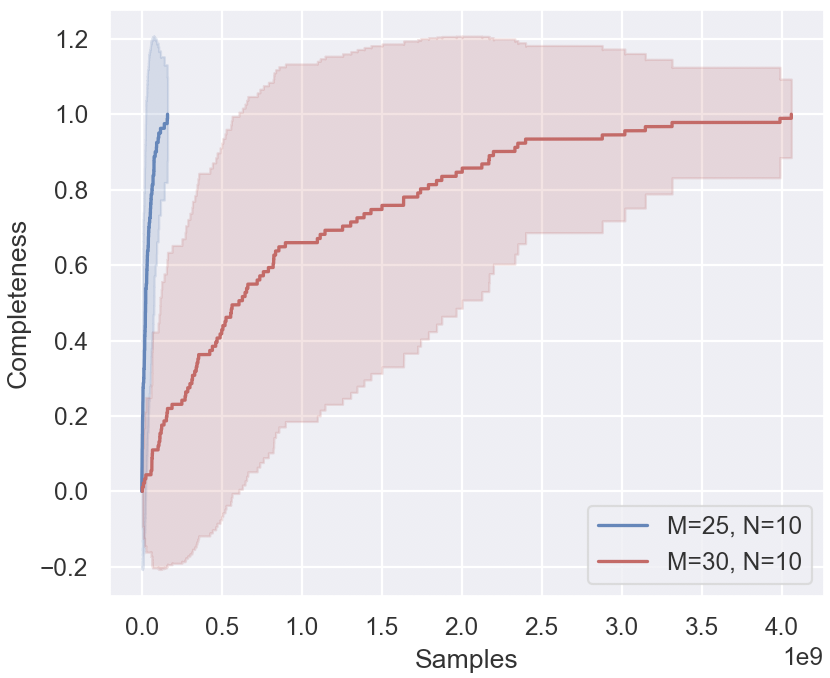
The image depicts a line graph comparing the "Completeness" metric across increasing "Samples" (x-axis, up to 4.0e9) for two configurations: M=25,N=10 (blue line) and M=30,N=10 (red line). Shaded regions around each line represent variability or confidence intervals. Both lines trend downward as Samples increase, but the M=25,N=10 configuration shows a steeper decline and greater variability.
### Components/Axes
- **X-axis (Samples)**: Labeled "Samples," with values ranging from 0 to 4.0e9 (4 billion) in increments of 1e9.
- **Y-axis (Completeness)**: Labeled "Completeness," with values from -0.2 to 1.2 in increments of 0.2.
- **Legend**: Located in the bottom-right corner, with two entries:
- Blue line: "M=25, N=10"
- Red line: "M=30, N=10"
- **Shaded Regions**: Gray bands around each line indicate variability or uncertainty in measurements.
### Detailed Analysis
1. **M=25,N=10 (Blue Line)**:
- Starts at ~1.0 Completeness at 0 Samples, peaking at ~1.2 near 0.5e9 Samples.
- Declines sharply to ~0.8 at 1e9 Samples, ~0.6 at 2e9, ~0.4 at 3e9, and ~0.2 at 4e9.
- Shaded region is widest at the start (~0.1 range) and narrows slightly as Samples increase.
2. **M=30,N=10 (Red Line)**:
- Begins at ~0.8 Completeness at 0 Samples, rising to ~0.9 near 0.5e9.
- Declines more gradually: ~0.7 at 1e9, ~0.5 at 2e9, ~0.3 at 3e9, and ~0.1 at 4e9.
- Shaded region is narrower (~0.05 range) and remains relatively consistent across Samples.
### Key Observations
- The M=25,N=10 configuration exhibits a **steeper decline** in Completeness compared to M=30,N=10.
- The M=25,N=10 line has **higher variability** (wider shaded region), suggesting less stable measurements.
- Both lines trend downward, but M=30,N=10 maintains higher Completeness values at larger Sample sizes.
- The blue line’s peak (~1.2) exceeds the red line’s maximum (~0.9), but its decline is more pronounced.
### Interpretation
The data suggests that increasing M (from 25 to 30) improves the system’s ability to maintain Completeness under larger Sample sizes, with reduced variability. The M=25,N=10 configuration may represent a less robust or less optimized system, as its Completeness drops more sharply and shows greater uncertainty. The shaded regions imply that measurements for M=25,N=10 are less reliable, possibly due to higher noise or instability in the system. This could indicate trade-offs between M and N parameters in balancing performance and stability.