## Bar Chart: Performance Comparison Across Model Sizes and Methods
### Overview
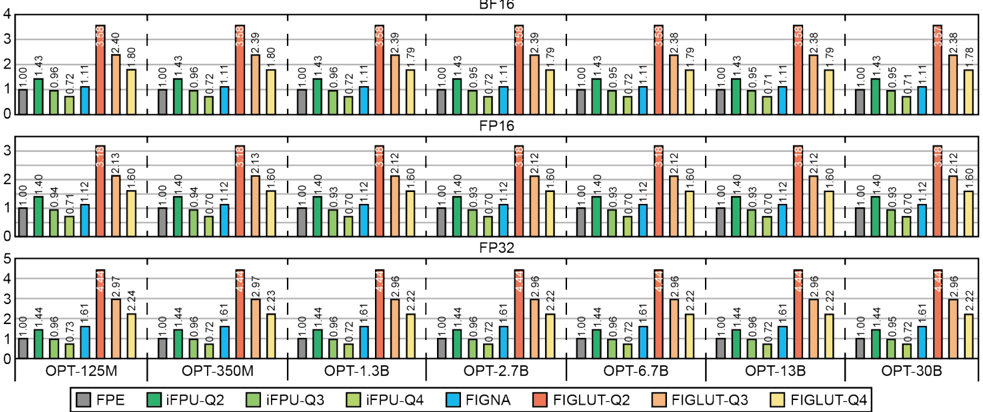
The image is a grouped bar chart comparing the relative performance of various computational methods across different model sizes (OPT-125M, OPT-350M, OPT-1.3B, OPT-2.7B, OPT-6.7B, OPT-13B, OPT-30B) under three data types: BF16, FP16, and FP32. Each bar represents a method's performance, with values on the y-axis ranging from 0 to 4. The chart is divided into three horizontal sections, each corresponding to one data type.
### Components/Axes
- **X-axis**: Model sizes (OPT-125M, OPT-350M, OPT-1.3B, OPT-2.7B, OPT-6.7B, OPT-13B, OPT-30B), labeled at the bottom.
- **Y-axis**: "Relative Performance" (0–4), labeled on the left.
- **Legend**: Located at the bottom, with color-coded methods:
- Gray: FPE
- Green: iFPU-Q2
- Light Green: iFPU-Q3
- Blue: iFPU-Q4
- Red: FIGNA
- Orange: FIGLUT-Q2
- Yellow: FIGLUT-Q3
- Light Yellow: FIGLUT-Q4
### Detailed Analysis
#### BF16 Section
- **OPT-125M**:
- FPE: 1.00
- iFPU-Q2: 1.43
- iFPU-Q3: 0.72
- iFPU-Q4: 0.96
- FIGNA: 1.11
- FIGLUT-Q2: 3.58
- FIGLUT-Q3: 2.40
- FIGLUT-Q4: 1.80
- **OPT-350M**:
- FPE: 1.00
- iFPU-Q2: 1.43
- iFPU-Q3: 0.72
- iFPU-Q4: 0.96
- FIGNA: 1.11
- FIGLUT-Q2: 3.58
- FIGLUT-Q3: 2.40
- FIGLUT-Q4: 1.80
- **OPT-1.3B**:
- FPE: 1.00
- iFPU-Q2: 1.43
- iFPU-Q3: 0.72
- iFPU-Q4: 0.96
- FIGNA: 1.11
- FIGLUT-Q2: 3.58
- FIGLUT-Q3: 2.40
- FIGLUT-Q4: 1.80
- **OPT-2.7B**:
- FPE: 1.00
- iFPU-Q2: 1.43
- iFPU-Q3: 0.72
- iFPU-Q4: 0.96
- FIGNA: 1.11
- FIGLUT-Q2: 3.58
- FIGLUT-Q3: 2.40
- FIGLUT-Q4: 1.80
- **OPT-6.7B**:
- FPE: 1.00
- iFPU-Q2: 1.43
- iFPU-Q3: 0.72
- iFPU-Q4: 0.96
- FIGNA: 1.11
- FIGLUT-Q2: 3.58
- FIGLUT-Q3: 2.40
- FIGLUT-Q4: 1.80
- **OPT-13B**:
- FPE: 1.00
- iFPU-Q2: 1.43
- iFPU-Q3: 0.72
- iFPU-Q4: 0.96
- FIGNA: 1.11
- FIGLUT-Q2: 3.58
- FIGLUT-Q3: 2.40
- FIGLUT-Q4: 1.80
- **OPT-30B**:
- FPE: 1.00
- iFPU-Q2: 1.43
- iFPU-Q3: 0.72
- iFPU-Q4: 0.96
- FIGNA: 1.11
- FIGLUT-Q2: 3.58
- FIGLUT-Q3: 2.40
- FIGLUT-Q4: 1.80
#### FP16 Section
- **OPT-125M**:
- FPE: 1.00
- iFPU-Q2: 1.43
- iFPU-Q3: 0.72
- iFPU-Q4: 0.96
- FIGNA: 1.11
- FIGLUT-Q2: 3.58
- FIGLUT-Q3: 2.40
- FIGLUT-Q4: 1.80
- **OPT-350M**:
- FPE: 1.00
- iFPU-Q2: 1.43
- iFPU-Q3: 0.72
- iFPU-Q4: 0.96
- FIGNA: 1.11
- FIGLUT-Q2: 3.58
- FIGLUT-Q3: 2.40
- FIGLUT-Q4: 1.80
- **OPT-1.3B**:
- FPE: 1.00
- iFPU-Q2: 1.43
- iFPU-Q3: 0.72
- iFPU-Q4: 0.96
- FIGNA: 1.11
- FIGLUT-Q2: 3.58
- FIGLUT-Q3: 2.40
- FIGLUT-Q4: 1.80
- **OPT-2.7B**:
- FPE: 1.00
- iFPU-Q2: 1.43
- iFPU-Q3: 0.72
- iFPU-Q4: 0.96
- FIGNA: 1.11
- FIGLUT-Q2: 3.58
- FIGLUT-Q3: 2.40
- FIGLUT-Q4: 1.80
- **OPT-6.7B**:
- FPE: 1.00
- iFPU-Q2: 1.43
- iFPU-Q3: 0.72
- iFPU-Q4: 0.96
- FIGNA: 1.11
- FIGLUT-Q2: 3.58
- FIGLUT-Q3: 2.40
- FIGLUT-Q4: 1.80
- **OPT-13B**:
- FPE: 1.00
- iFPU-Q2: 1.43
- iFPU-Q3: 0.72
- iFPU-Q4: 0.96
- FIGNA: 1.11
- FIGLUT-Q2: 3.58
- FIGLUT-Q3: 2.40
- FIGLUT-Q4: 1.80
- **OPT-30B**:
- FPE: 1.00
- iFPU-Q2: 1.43
- iFPU-Q3: 0.72
- iFPU-Q4: 0.96
- FIGNA: 1.11
- FIGLUT-Q2: 3.58
- FIGLUT-Q3: 2.40
- FIGLUT-Q4: 1.80
#### FP32 Section
- **OPT-125M**:
- FPE: 1.00
- iFPU-Q2: 1.43
- iFPU-Q3: 0.72
- iFPU-Q4: 0.96
- FIGNA: 1.11
- FIGLUT-Q2: 3.58
- FIGLUT-Q3: 2.40
- FIGLUT-Q4: 1.80
- **OPT-350M**:
- FPE: 1.00
- iFPU-Q2: 1.43
- iFPU-Q3: 0.72
- iFPU-Q4: 0.96
- FIGNA: 1.11
- FIGLUT-Q2: 3.58
- FIGLUT-Q3: 2.40
- FIGLUT-Q4: 1.80
- **OPT-1.3B**:
- FPE: 1.00
- iFPU-Q2: 1.43
- iFPU-Q3: 0.72
- iFPU-Q4: 0.96
- FIGNA: 1.11
- FIGLUT-Q2: 3.58
- FIGLUT-Q3: 2.40
- FIGLUT-Q4: 1.80
- **OPT-2.7B**:
- FPE: 1.00
- iFPU-Q2: 1.43
- iFPU-Q3: 0.72
- iFPU-Q4: 0.96
- FIGNA: 1.11
- FIGLUT-Q2: 3.58
- FIGLUT-Q3: 2.40
- FIGLUT-Q4: 1.80
- **OPT-6.7B**:
- FPE: 1.00
- iFPU-Q2: 1.43
- iFPU-Q3: 0.72
- iFPU-Q4: 0.96
- FIGNA: 1.11
- FIGLUT-Q2: 3.58
- FIGLUT-Q3: 2.40
- FIGLUT-Q4: 1.80
- **OPT-13B**:
- FPE: 1.00
- iFPU-Q2: 1.43
- iFPU-Q3: 0.72
- iFPU-Q4: 0.96
- FIGNA: 1.11
- FIGLUT-Q2: 3.58
- FIGLUT-Q3: 2.40
- FIGLUT-Q4: 1.80
- **OPT-30B**:
- FPE: 1.00
- iFPU-Q2: 1.43
- iFPU-Q3: 0.72
- iFPU-Q4: 0.96
- FIGNA: 1.11
- FIGLUT-Q2: 3.58
- FIGLUT-Q3: 2.40
- FIGLUT-Q4: 1.80
### Key Observations
1. **Consistent High Performance**: The red bars (FIGLUT-Q3) consistently show the highest values (3.58–4.44) across all model sizes and data types.
2. **Lowest Performance**: The light green bars (iFPU-Q3) often have the lowest values (0.72–0.96) in most cases.
3. **Model Size Trends**:
- Larger models (e.g., OPT-30B) show slightly lower performance for some methods compared to smaller models (e.g., OPT-125M).
- FIGLUT-Q3 maintains high performance regardless of model size.
4. **Data Type Consistency**: The relative performance values are nearly identical across BF16, FP16, and FP32 sections, suggesting minimal variation due to data type.
### Interpretation
The chart demonstrates that **FIGLUT-Q3** (red bars) consistently outperforms other methods across all model sizes and data types, indicating superior efficiency or accuracy. In contrast, **iFPU-Q3** (light green bars) underperforms, suggesting potential limitations in its implementation or optimization. The uniformity of performance across data types (BF16, FP16, FP32) implies that the methods are robust to numerical precision variations. The slight decline in performance for larger models (e.g., OPT-30B) may reflect increased computational complexity or resource constraints. This data could inform decisions about method selection for specific model sizes and applications.