## Line Chart: Mean Pass Rate vs. Mean Number of Tokens Generated
### Overview
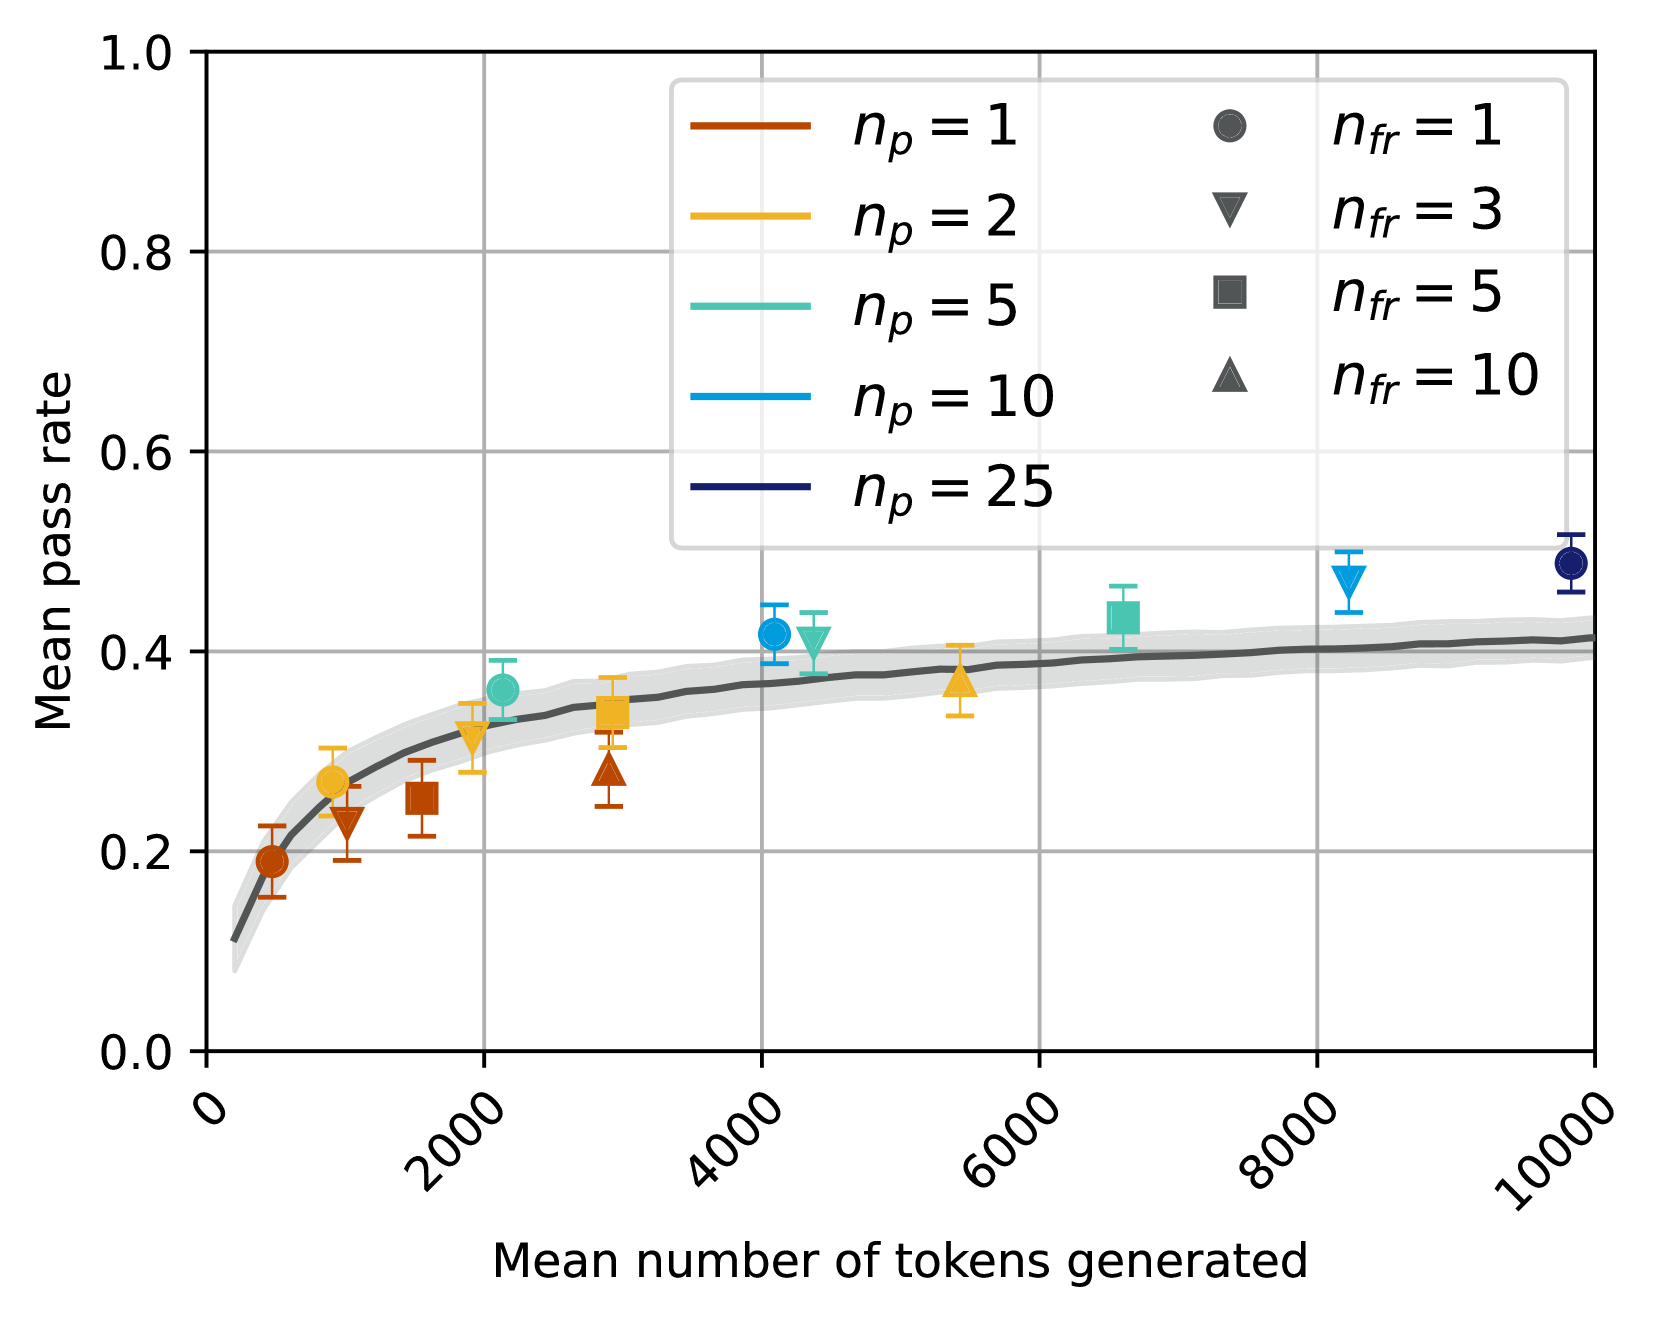
This chart displays the relationship between the mean pass rate and the mean number of tokens generated, with different lines representing varying values of *n<sub>p</sub>* (1, 2, 5, 10, 25) and data points colored by *n<sub>fr</sub>* (1, 3, 5, 10). Error bars are present for each data point, indicating the variability in the pass rate. A shaded gray area represents the confidence interval around the *n<sub>p</sub>* = 25 line.
### Components/Axes
* **X-axis:** Mean number of tokens generated, ranging from 0 to 10000, with tick marks at 0, 2000, 4000, 6000, 8000, and 10000.
* **Y-axis:** Mean pass rate, ranging from 0.0 to 1.0, with tick marks at 0.0, 0.2, 0.4, 0.6, 0.8, and 1.0.
* **Lines:** Five lines representing different values of *n<sub>p</sub>*:
* *n<sub>p</sub>* = 1 (Brown)
* *n<sub>p</sub>* = 2 (Orange)
* *n<sub>p</sub>* = 5 (Light Green)
* *n<sub>p</sub>* = 10 (Blue)
* *n<sub>p</sub>* = 25 (Purple)
* **Data Points:** Data points are colored to represent different values of *n<sub>fr</sub>*:
* *n<sub>fr</sub>* = 1 (Gray Circle)
* *n<sub>fr</sub>* = 3 (Red Downward Triangle)
* *n<sub>fr</sub>* = 5 (Black Square)
* *n<sub>fr</sub>* = 10 (Gray Upward Triangle)
* **Legend:** Located in the top-right corner, detailing the line colors and corresponding *n<sub>p</sub>* values, and the data point shapes and corresponding *n<sub>fr</sub>* values.
### Detailed Analysis
Let's analyze each line and its associated data points:
* ***n<sub>p</sub>* = 1 (Brown):** The line starts at approximately 0.18 at 0 tokens and increases to approximately 0.38 at 8000 tokens, with some fluctuation. Data points are:
* (0, 0.18) - *n<sub>fr</sub>* = 1
* (2000, 0.28) - *n<sub>fr</sub>* = 3
* (4000, 0.32) - *n<sub>fr</sub>* = 5
* (6000, 0.36) - *n<sub>fr</sub>* = 1
* (8000, 0.38) - *n<sub>fr</sub>* = 3
* ***n<sub>p</sub>* = 2 (Orange):** The line starts at approximately 0.19 at 0 tokens and increases to approximately 0.42 at 8000 tokens. Data points are:
* (0, 0.19) - *n<sub>fr</sub>* = 1
* (2000, 0.33) - *n<sub>fr</sub>* = 3
* (4000, 0.37) - *n<sub>fr</sub>* = 5
* (6000, 0.41) - *n<sub>fr</sub>* = 1
* (8000, 0.42) - *n<sub>fr</sub>* = 3
* ***n<sub>p</sub>* = 5 (Light Green):** The line starts at approximately 0.21 at 0 tokens and increases to approximately 0.43 at 8000 tokens. Data points are:
* (0, 0.21) - *n<sub>fr</sub>* = 1
* (2000, 0.35) - *n<sub>fr</sub>* = 3
* (4000, 0.39) - *n<sub>fr</sub>* = 5
* (6000, 0.42) - *n<sub>fr</sub>* = 1
* (8000, 0.43) - *n<sub>fr</sub>* = 3
* ***n<sub>p</sub>* = 10 (Blue):** The line starts at approximately 0.23 at 0 tokens and increases to approximately 0.45 at 8000 tokens. Data points are:
* (0, 0.23) - *n<sub>fr</sub>* = 1
* (2000, 0.37) - *n<sub>fr</sub>* = 3
* (4000, 0.41) - *n<sub>fr</sub>* = 5
* (6000, 0.44) - *n<sub>fr</sub>* = 1
* (8000, 0.45) - *n<sub>fr</sub>* = 3
* ***n<sub>p</sub>* = 25 (Purple):** The line starts at approximately 0.25 at 0 tokens and increases to approximately 0.50 at 8000 tokens. A shaded gray area surrounds this line, representing a confidence interval. Data points are:
* (0, 0.25) - *n<sub>fr</sub>* = 1
* (2000, 0.39) - *n<sub>fr</sub>* = 3
* (4000, 0.43) - *n<sub>fr</sub>* = 5
* (6000, 0.46) - *n<sub>fr</sub>* = 1
* (8000, 0.47) - *n<sub>fr</sub>* = 3
* (10000, 0.51) - *n<sub>fr</sub>* = 1
All lines generally exhibit an upward trend, indicating that as the mean number of tokens generated increases, the mean pass rate also tends to increase.
### Key Observations
* The *n<sub>p</sub>* = 25 line consistently has the highest mean pass rate across all token counts.
* The lines for different *n<sub>p</sub>* values converge at lower token counts and diverge as the number of tokens increases.
* The data points for *n<sub>fr</sub>* = 1 generally have lower pass rates compared to other *n<sub>fr</sub>* values.
* The confidence interval around the *n<sub>p</sub>* = 25 line suggests a higher degree of certainty in the pass rate for this value.
### Interpretation
The chart demonstrates a positive correlation between the mean number of tokens generated and the mean pass rate, particularly for higher values of *n<sub>p</sub>*. This suggests that increasing the number of tokens generated can improve the pass rate, but the effect is more pronounced when *n<sub>p</sub>* is larger. The parameter *n<sub>p</sub>* likely represents a prompt parameter, and *n<sub>fr</sub>* a feedback parameter. The confidence interval around the *n<sub>p</sub>* = 25 line indicates that this value provides a more stable and predictable pass rate. The convergence of the lines at lower token counts suggests that the effect of *n<sub>p</sub>* is less significant when fewer tokens are generated. The varying pass rates for different *n<sub>fr</sub>* values suggest that the feedback mechanism also influences the overall performance. The data suggests that a combination of a higher prompt parameter (*n<sub>p</sub>* = 25) and a suitable feedback parameter (*n<sub>fr</sub>*) is optimal for achieving a high pass rate.