## Diagram: System State Evolution
### Overview
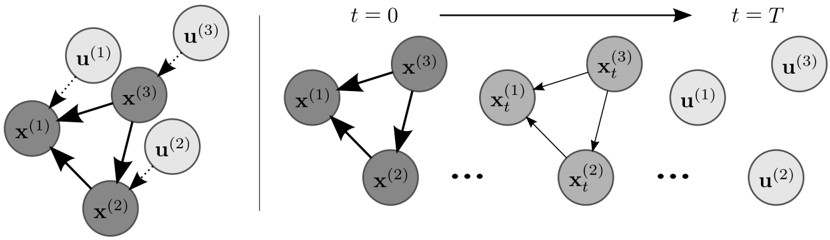
The image depicts the evolution of a system's state over time, represented by interconnected nodes. The diagram is divided into three stages: an initial state, an intermediate state at time t=0, and a final state at time t=T. The nodes represent system states (x) and external inputs (u), with arrows indicating dependencies or influences between them.
### Components/Axes
* **Nodes:** Represented by circles, labeled as x<sup>(i)</sup> for system states and u<sup>(i)</sup> for external inputs, where i = 1, 2, or 3.
* **Arrows:** Indicate dependencies or influences between nodes. Solid arrows represent direct influence, while dotted arrows represent a weaker or less direct influence.
* **Time:** The diagram progresses from left to right, showing the system's evolution over time. The stages are labeled as initial state, t=0, and t=T.
* **Colors:** Dark gray nodes represent system states (x), while light gray nodes represent external inputs (u).
### Detailed Analysis
**Initial State (Leftmost Diagram):**
* Three state nodes: x<sup>(1)</sup>, x<sup>(2)</sup>, and x<sup>(3)</sup>, all in dark gray.
* Three input nodes: u<sup>(1)</sup>, u<sup>(2)</sup>, and u<sup>(3)</sup>, all in light gray.
* x<sup>(3)</sup> influences x<sup>(1)</sup> and x<sup>(2)</sup>.
* x<sup>(1)</sup> influences x<sup>(2)</sup>.
* u<sup>(1)</sup> influences x<sup>(1)</sup> (dotted arrow).
* u<sup>(2)</sup> influences x<sup>(2)</sup> (dotted arrow).
* u<sup>(3)</sup> influences x<sup>(3)</sup> (dotted arrow).
**State at t=0 (Middle Diagram):**
* Three state nodes: x<sup>(1)</sup>, x<sup>(2)</sup>, and x<sup>(3)</sup>, all in dark gray.
* x<sup>(3)</sup> influences x<sup>(1)</sup> and x<sup>(2)</sup>.
* x<sup>(1)</sup> influences x<sup>(2)</sup>.
* No input nodes are shown at this stage.
**State at t=T (Rightmost Diagram):**
* Three state nodes: x<sub>t</sub><sup>(1)</sup>, x<sub>t</sub><sup>(2)</sup>, and x<sub>t</sub><sup>(3)</sup>, all in dark gray.
* Three input nodes: u<sup>(1)</sup>, u<sup>(2)</sup>, and u<sup>(3)</sup>, all in light gray.
* x<sub>t</sub><sup>(3)</sup> influences x<sub>t</sub><sup>(2)</sup>.
* x<sub>t</sub><sup>(1)</sup> influences x<sub>t</sub><sup>(2)</sup>.
* The "..." notation indicates that there may be intermediate states or processes between t=0 and t=T.
### Key Observations
* The system's state evolves over time, with dependencies between state variables.
* External inputs influence the initial state, but their influence is not explicitly shown at t=0.
* The diagram suggests a dynamic system where the state at one time step influences the state at the next.
* The dotted arrows indicate a weaker or less direct influence of the inputs on the states.
### Interpretation
The diagram illustrates a system where the state variables (x) are interconnected and influenced by external inputs (u). The evolution of the system from the initial state to t=0 and finally to t=T shows how the dependencies between the state variables and the external inputs change over time. The "..." notation suggests that the system's evolution may involve complex dynamics or intermediate states that are not explicitly shown in the diagram. The diagram could represent a control system, a physical process, or any other system where the state variables are influenced by external factors and each other. The dotted arrows could represent feedback loops or indirect influences.