\n
## Diagram: System State Transition over Time
### Overview
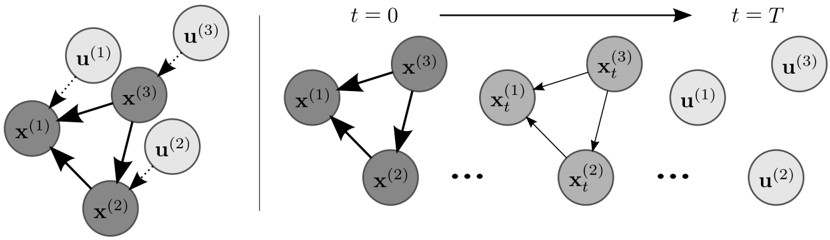
The image depicts a directed graph illustrating the state transition of a system over time, from an initial state at *t* = 0 to a final state at *t* = *T*. The diagram shows three variables, denoted as x<sup>(1)</sup>, x<sup>(2)</sup>, and x<sup>(3)</sup>, and their corresponding inputs u<sup>(1)</sup>, u<sup>(2)</sup>, and u<sup>(3)</sup>. The left side of the diagram shows the initial state, while the right side shows the system evolving over time, represented by the subscript *t*.
### Components/Axes
The diagram consists of nodes representing system states and variables, and directed edges representing the flow of influence or dependency. The diagram is divided into two sections by a vertical line. The left section shows the initial state, and the right section shows the system's evolution over time. The time axis is indicated above the right section, ranging from *t* = 0 to *t* = *T*.
The variables are labeled as follows:
* x<sup>(1)</sup>
* x<sup>(2)</sup>
* x<sup>(3)</sup>
* u<sup>(1)</sup>
* u<sup>(2)</sup>
* u<sup>(3)</sup>
The subscript *t* denotes the state of the variables at time *t*.
### Detailed Analysis or Content Details
The left side of the diagram shows the initial state. x<sup>(1)</sup> has an incoming arrow from u<sup>(1)</sup> and an outgoing arrow to x<sup>(3)</sup>. x<sup>(2)</sup> has an incoming arrow from u<sup>(2)</sup> and an outgoing arrow to x<sup>(3)</sup>. x<sup>(3)</sup> has incoming arrows from both x<sup>(1)</sup> and x<sup>(2)</sup>, and an outgoing arrow to u<sup>(3)</sup>.
The right side of the diagram shows the system evolving over time. The variables x<sup>(1)</sup>, x<sup>(2)</sup>, and x<sup>(3)</sup> are shown at multiple time steps, denoted by the subscript *t*. The connections between the variables remain consistent over time. x<sub>t</sub><sup>(1)</sup> receives input from u<sup>(1)</sup> and influences x<sub>t</sub><sup>(3)</sup>. x<sub>t</sub><sup>(2)</sup> receives input from u<sup>(2)</sup> and influences x<sub>t</sub><sup>(3)</sup>. x<sub>t</sub><sup>(3)</sup> receives input from both x<sub>t</sub><sup>(1)</sup> and x<sub>t</sub><sup>(2)</sup> and influences u<sup>(3)</sup>. The ellipsis (...) indicates that this pattern continues for multiple time steps until *t* = *T*.
The final state at *t* = *T* shows the variables u<sup>(1)</sup>, u<sup>(2)</sup>, and u<sup>(3)</sup>, indicating that the system's output is determined by the final states of the variables.
### Key Observations
The diagram illustrates a dynamic system where the state of each variable at time *t* depends on its previous state and the inputs it receives. The system appears to be interconnected, with each variable influencing others. The diagram does not provide specific numerical values or equations, but rather a qualitative representation of the system's behavior.
### Interpretation
The diagram represents a state-space model of a dynamic system. The variables x<sup>(1)</sup>, x<sup>(2)</sup>, and x<sup>(3)</sup> represent the system's states, and the variables u<sup>(1)</sup>, u<sup>(2)</sup>, and u<sup>(3)</sup> represent the inputs and outputs of the system. The arrows indicate the causal relationships between the variables.
The diagram suggests that the system's behavior evolves over time based on its initial state and the inputs it receives. The system is interconnected, meaning that changes in one variable can affect the others. The diagram is a simplified representation of a complex system, and it does not provide any information about the specific dynamics of the system. However, it does provide a useful framework for understanding the system's overall behavior. The use of superscripts (1), (2), and (3) likely indicates different components or aspects of the system, while the subscript *t* denotes the time step. The diagram is a visual representation of a control system or a feedback loop.