\n
## Diagram: Network Graph
### Overview
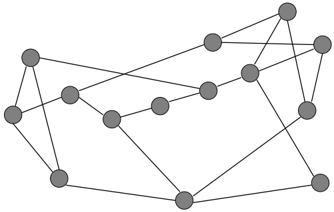
The image depicts a network graph consisting of 16 nodes (represented as gray circles) connected by lines (edges). There are no axis labels, legends, or numerical values present. The diagram illustrates relationships or connections between the nodes.
### Components/Axes
The diagram consists solely of nodes and edges. There are no explicit axes or legends. The nodes are uniformly sized and colored in gray. The edges are straight lines connecting the nodes.
### Detailed Analysis or Content Details
The diagram contains 16 nodes. The connections between nodes are as follows (listing each node and its direct connections):
1. Connected to nodes 2, 3, and 4.
2. Connected to nodes 1, 5, and 6.
3. Connected to nodes 1, 7, and 8.
4. Connected to nodes 1, 9, and 10.
5. Connected to nodes 2, 6, and 11.
6. Connected to nodes 2, 5, 12, and 13.
7. Connected to nodes 3, 8, and 14.
8. Connected to nodes 3, 7, and 15.
9. Connected to nodes 4, 10, and 16.
10. Connected to nodes 4, 9, and 16.
11. Connected to nodes 5, 12, and 13.
12. Connected to nodes 6, 11, and 13.
13. Connected to nodes 6, 11, and 12.
14. Connected to nodes 7, 15, and 16.
15. Connected to nodes 8, 14, and 16.
16. Connected to nodes 9, 10, 14, and 15.
There is no apparent directionality to the edges; they appear to represent undirected relationships.
### Key Observations
The graph appears relatively dense, with most nodes having multiple connections. Nodes 6, 13, 14, 15, and 16 have the highest degree (number of connections). Nodes 1, 2, 3, 4, 5, 7, 8, 9, 10, 11, and 12 have a lower degree. The graph does not exhibit any obvious clustering or modularity.
### Interpretation
The diagram represents a network of interconnected entities. Without further context, it's difficult to determine the specific meaning of the nodes and edges. However, the structure suggests a complex system where information or influence can flow between the nodes. The higher degree nodes (6, 13, 14, 15, and 16) likely play a central role in the network, acting as hubs or intermediaries. The lack of directionality suggests that the relationships are reciprocal or symmetric.
The diagram could represent a social network, a communication network, a transportation network, or any other system where entities are connected by relationships. The specific interpretation depends on the context in which the diagram is used. The absence of labels or numerical data limits the depth of analysis that can be performed. It is a purely structural representation of connectivity.