## Network Diagram: Unlabeled Graph Structure
### Overview
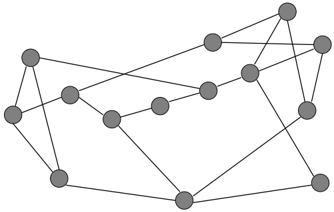
The image displays an undirected network graph consisting of nodes (vertices) and edges (connections). There is no textual information, labels, titles, legends, or numerical data present in the image. The graph is purely structural, composed of gray circular nodes connected by black lines against a white background.
### Components/Axes
* **Nodes:** 15 gray circles of uniform size and color. They are distributed across the plane with no apparent coordinate system or axis.
* **Edges:** Straight black lines connecting pairs of nodes. The lines have uniform thickness and color.
* **Labels/Text:** None. No node identifiers, edge weights, titles, or annotations are present.
* **Legend:** None.
* **Language:** No textual content is present in any language.
### Detailed Analysis
**Spatial Grounding & Component Isolation:**
The graph can be segmented into approximate regions for analysis:
* **Left Cluster (Approx. 5 nodes):** A relatively dense grouping on the left side. One node at the far left connects to two others, forming a small triangle. Another node slightly inward connects to multiple nodes across the graph.
* **Central Chain (Approx. 4 nodes):** A loose, horizontal chain of nodes runs through the center, connecting the left and right clusters.
* **Right Cluster (Approx. 6 nodes):** A more complex and densely interconnected grouping on the right. This area contains the highest degree of connectivity, with several nodes acting as local hubs.
* **Peripheral Nodes:** A few nodes are positioned at the top, bottom, and far right edges, connected by one or two edges to the main structure.
**Connectivity & Flow:**
* The graph is fully connected; there are no isolated nodes or separate components.
* There is no indicated directionality (arrows), so all connections are bidirectional.
* Node connectivity (degree) varies. Some nodes (e.g., one in the central chain and one in the right cluster) appear to have 4-5 connections, acting as local hubs. Others on the periphery have only 1-2 connections.
### Key Observations
1. **Absence of Metadata:** The complete lack of labels, keys, or scales makes it impossible to assign specific meaning, identity, or quantitative value to any element.
2. **Structural Patterns:** The graph exhibits small-world properties, with local clusters (left and right) connected by a few bridging nodes in the center.
3. **Visual Uniformity:** All nodes and edges are visually identical, implying no differentiation by type, weight, or capacity based on the visual information alone.
4. **Non-Planar Layout:** The edges cross each other multiple times, indicating the graph is not drawn in a planar fashion (where no edges cross). This is a common layout choice for readability rather than a property of the graph itself.
### Interpretation
This image is a pure representation of a **network topology**. Its meaning is entirely dependent on external context not provided in the image.
* **What it Demonstrates:** It shows a set of entities (nodes) and the relationships or connections between them (edges). The structure suggests a system where some entities are more central or influential (higher-degree nodes) than others.
* **Potential Analogies:** Without labels, this could represent countless systems: a social network, a computer network, a neural pathway, a chemical interaction map, a transportation grid, or an organizational chart.
* **Notable Anomalies:** The primary "anomaly" is the complete absence of explanatory data. For a technical document, this graph is a skeleton awaiting annotation. Its utility is in illustrating connectivity patterns, clustering, and network density in the abstract.
* **Peircean Investigation:** The image is an **icon** (it resembles a network) and a **symbol** (its meaning is conventional, requiring learned interpretation). It lacks an **index** (a direct physical or causal link to a specific real-world system) because there are no labels to ground it. To be informative, it must be paired with a legend or accompanying text that defines what the nodes and edges represent.
**Conclusion for Documentation:** This diagram effectively conveys the abstract structure of a connected network with 15 nodes and visible clustering. However, for it to serve as a technical document, it requires the addition of a key defining node identities, edge meanings, and possibly node/edge attributes (e.g., size for importance, color for type). As provided, it is a template of relationships without semantic content.