## Diagram: Network Topology Illustration
### Overview
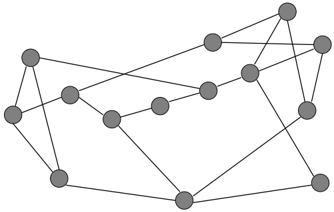
The image depicts an undirected network graph consisting of 15 nodes (represented as gray circles) interconnected by 22 edges (represented as black lines). No labels, legends, or axis markers are present. The nodes are uniformly styled, and edges vary in length and orientation, suggesting a non-hierarchical, possibly random or scale-free network structure.
### Components/Axes
- **Nodes**: 15 gray circular vertices with no distinguishing features (e.g., labels, colors, or sizes).
- **Edges**: 22 black lines connecting nodes, with no directional arrows or weights indicated.
- **Absent Elements**: No legends, axis titles, or textual annotations are visible.
### Detailed Analysis
- **Node Distribution**: Nodes are distributed unevenly across the diagram, with clusters in the upper-right and lower-left regions.
- **Edge Density**: Edges are concentrated in the central region, forming dense subgraphs, while peripheral nodes have fewer connections.
- **Connectivity**: The network appears fully connected, with no isolated nodes or disconnected subgraphs.
### Key Observations
1. **Central Hubs**: Nodes in the central region (e.g., positions ~center-right and ~center-bottom) have higher edge density, suggesting potential hub nodes.
2. **Peripheral Nodes**: Nodes at the periphery (e.g., top-left and bottom-right) have fewer connections, indicating lower connectivity.
3. **No Labels**: The absence of node/edge labels or legends prevents identification of specific entities or relationships.
### Interpretation
This diagram likely represents a generic network topology, possibly for illustrative purposes in fields like computer science (e.g., social networks, communication systems) or biology (e.g., neural or protein interaction networks). The lack of labels and uniform styling implies it is not tied to a specific dataset but serves as a conceptual model. The central hubs and peripheral nodes suggest a scale-free or small-world network structure, where critical nodes (hubs) may play a disproportionate role in connectivity. However, without additional context or data, this remains speculative.
### Limitations
- No factual data (e.g., node/edge weights, timestamps, or categorical labels) is present.
- The diagram’s purpose (e.g., theoretical vs. empirical) cannot be determined from the image alone.
**Note**: The image contains no textual information, numerical values, or categorical labels. All descriptions are based on visual structure and spatial relationships.