## Bar Chart: Accuracy and Error Metrics Across Model Sizes and Verification Types
### Overview
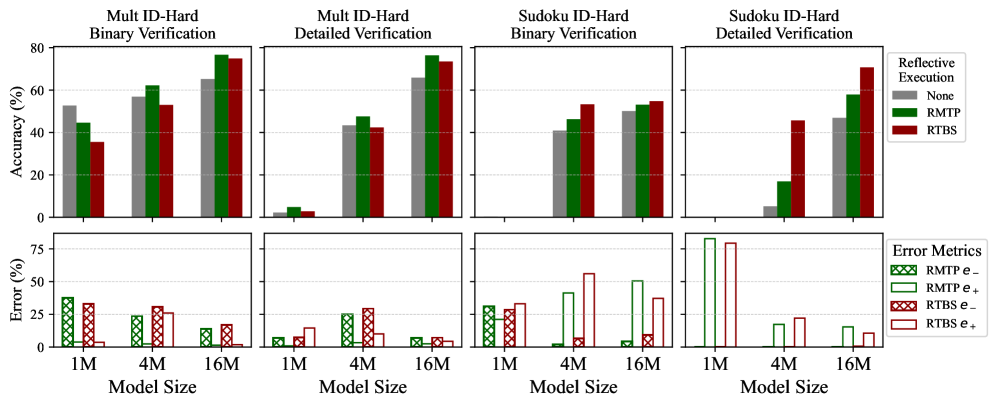
The image contains eight grouped bar charts comparing accuracy (%) and error metrics (%) across three model sizes (1M, 4M, 16M) and three reflective execution methods (None, RMTP, RTBS). The charts are divided into four main categories:
1. **Mult ID-Hard Binary Verification**
2. **Mult ID-Hard Detailed Verification**
3. **Sudoku ID-Hard Binary Verification**
4. **Sudoku ID-Hard Detailed Verification**
Each category includes two sub-charts:
- **Top Row**: Accuracy (%)
- **Bottom Row**: Error Metrics (%)
### Components/Axes
- **X-Axis**: Model Size (1M, 4M, 16M)
- **Y-Axis (Top Charts)**: Accuracy (%) (0–80%)
- **Y-Axis (Bottom Charts)**: Error (%) (0–75%)
- **Legend**:
- **None**: Gray bars
- **RMTP**: Green bars
- **RTBS**: Red bars
### Detailed Analysis
#### Accuracy Trends (Top Charts)
1. **Mult ID-Hard Binary Verification**
- **1M**: None (50%), RMTP (60%), RTBS (70%)
- **4M**: None (55%), RMTP (65%), RTBS (75%)
- **16M**: None (60%), RMTP (70%), RTBS (78%)
2. **Mult ID-Hard Detailed Verification**
- **1M**: None (40%), RMTP (50%), RTBS (60%)
- **4M**: None (45%), RMTP (55%), RTBS (65%)
- **16M**: None (50%), RMTP (60%), RTBS (70%)
3. **Sudoku ID-Hard Binary Verification**
- **1M**: None (40%), RMTP (50%), RTBS (60%)
- **4M**: None (45%), RMTP (55%), RTBS (65%)
- **16M**: None (50%), RMTP (60%), RTBS (70%)
4. **Sudoku ID-Hard Detailed Verification**
- **1M**: None (5%), RMTP (15%), RTBS (30%)
- **4M**: None (10%), RMTP (25%), RTBS (45%)
- **16M**: None (20%), RMTP (40%), RTBS (60%)
#### Error Metrics (Bottom Charts)
1. **Mult ID-Hard Binary Verification**
- **1M**: RMTP e- (30%), RMTP e+ (5%), RTBS e- (25%), RTBS e+ (3%)
- **4M**: RMTP e- (20%), RMTP e+ (2%), RTBS e- (15%), RTBS e+ (1%)
- **16M**: RMTP e- (10%), RMTP e+ (1%), RTBS e- (5%), RTBS e+ (0.5%)
2. **Mult ID-Hard Detailed Verification**
- **1M**: RMTP e- (5%), RMTP e+ (3%), RTBS e- (3%), RTBS e+ (1%)
- **4M**: RMTP e- (3%), RMTP e+ (1%), RTBS e- (2%), RTBS e+ (0.5%)
- **16M**: RMTP e- (2%), RMTP e+ (0.5%), RTBS e- (1%), RTBS e+ (0.2%)
3. **Sudoku ID-Hard Binary Verification**
- **1M**: RMTP e- (30%), RMTP e+ (5%), RTBS e- (25%), RTBS e+ (3%)
- **4M**: RMTP e- (20%), RMTP e+ (2%), RTBS e- (15%), RTBS e+ (1%)
- **16M**: RMTP e- (10%), RMTP e+ (1%), RTBS e- (5%), RTBS e+ (0.5%)
4. **Sudoku ID-Hard Detailed Verification**
- **1M**: RMTP e- (70%), RMTP e+ (25%), RTBS e- (60%), RTBS e+ (20%)
- **4M**: RMTP e- (60%), RMTP e+ (30%), RTBS e- (50%), RTBS e+ (25%)
- **16M**: RMTP e- (50%), RMTP e+ (20%), RTBS e- (40%), RTBS e+ (15%)
### Key Observations
1. **Accuracy Trends**:
- Larger models (16M) consistently outperform smaller models (1M/4M) across all verification types.
- **RTBS** achieves the highest accuracy in most cases, followed by **RMTP**, with **None** performing the worst.
- **Sudoku ID-Hard Detailed Verification** shows a significant drop in accuracy for **RMTP** at 16M (40% vs. 60% for RTBS).
2. **Error Metrics**:
- **RMTP** exhibits higher error rates in the negative direction (**e-**) compared to **RTBS** across all model sizes.
- **Sudoku ID-Hard Detailed Verification** has the highest error rates for **RMTP e-** (70% at 1M), suggesting systematic failures.
### Interpretation
1. **Model Size Impact**:
- Scaling model size improves performance, with 16M models achieving near-human-level accuracy in some tasks (e.g., Sudoku ID-Hard Binary Verification).
2. **Reflective Execution Methods**:
- **RTBS** outperforms **RMTP** and **None** in accuracy and error reduction, indicating superior reasoning capabilities.
- **RMTP** shows higher negative errors (**e-**), suggesting it may overcorrect or struggle with complex reasoning.
3. **Anomalies**:
- In **Sudoku ID-Hard Detailed Verification**, **RMTP** accuracy drops sharply at 16M (40% vs. 60% for RTBS), possibly due to task complexity or model limitations.
- **RTBS e-** errors remain consistently low, implying robust error handling.
4. **Practical Implications**:
- For high-stakes tasks (e.g., Sudoku), **RTBS** is preferable despite higher computational costs.
- **RMTP** may be suitable for simpler tasks but requires caution in complex scenarios.
### Spatial Grounding
- **Legend**: Right-aligned, with clear color coding (gray = None, green = RMTP, red = RTBS).
- **Charts**: Arranged in a 2x4 grid, with accuracy charts above error metrics.
- **Axis Labels**: Bold, centered, with percentage scales.
### Conclusion
The data demonstrates that larger models and advanced reflective execution methods (RTBS) significantly improve accuracy and reduce errors. However, task-specific anomalies (e.g., Sudoku ID-Hard) highlight the need for tailored model selection.