# Technical Document Extraction: Control Value vs. Time Chart
## Chart Title and Parameters
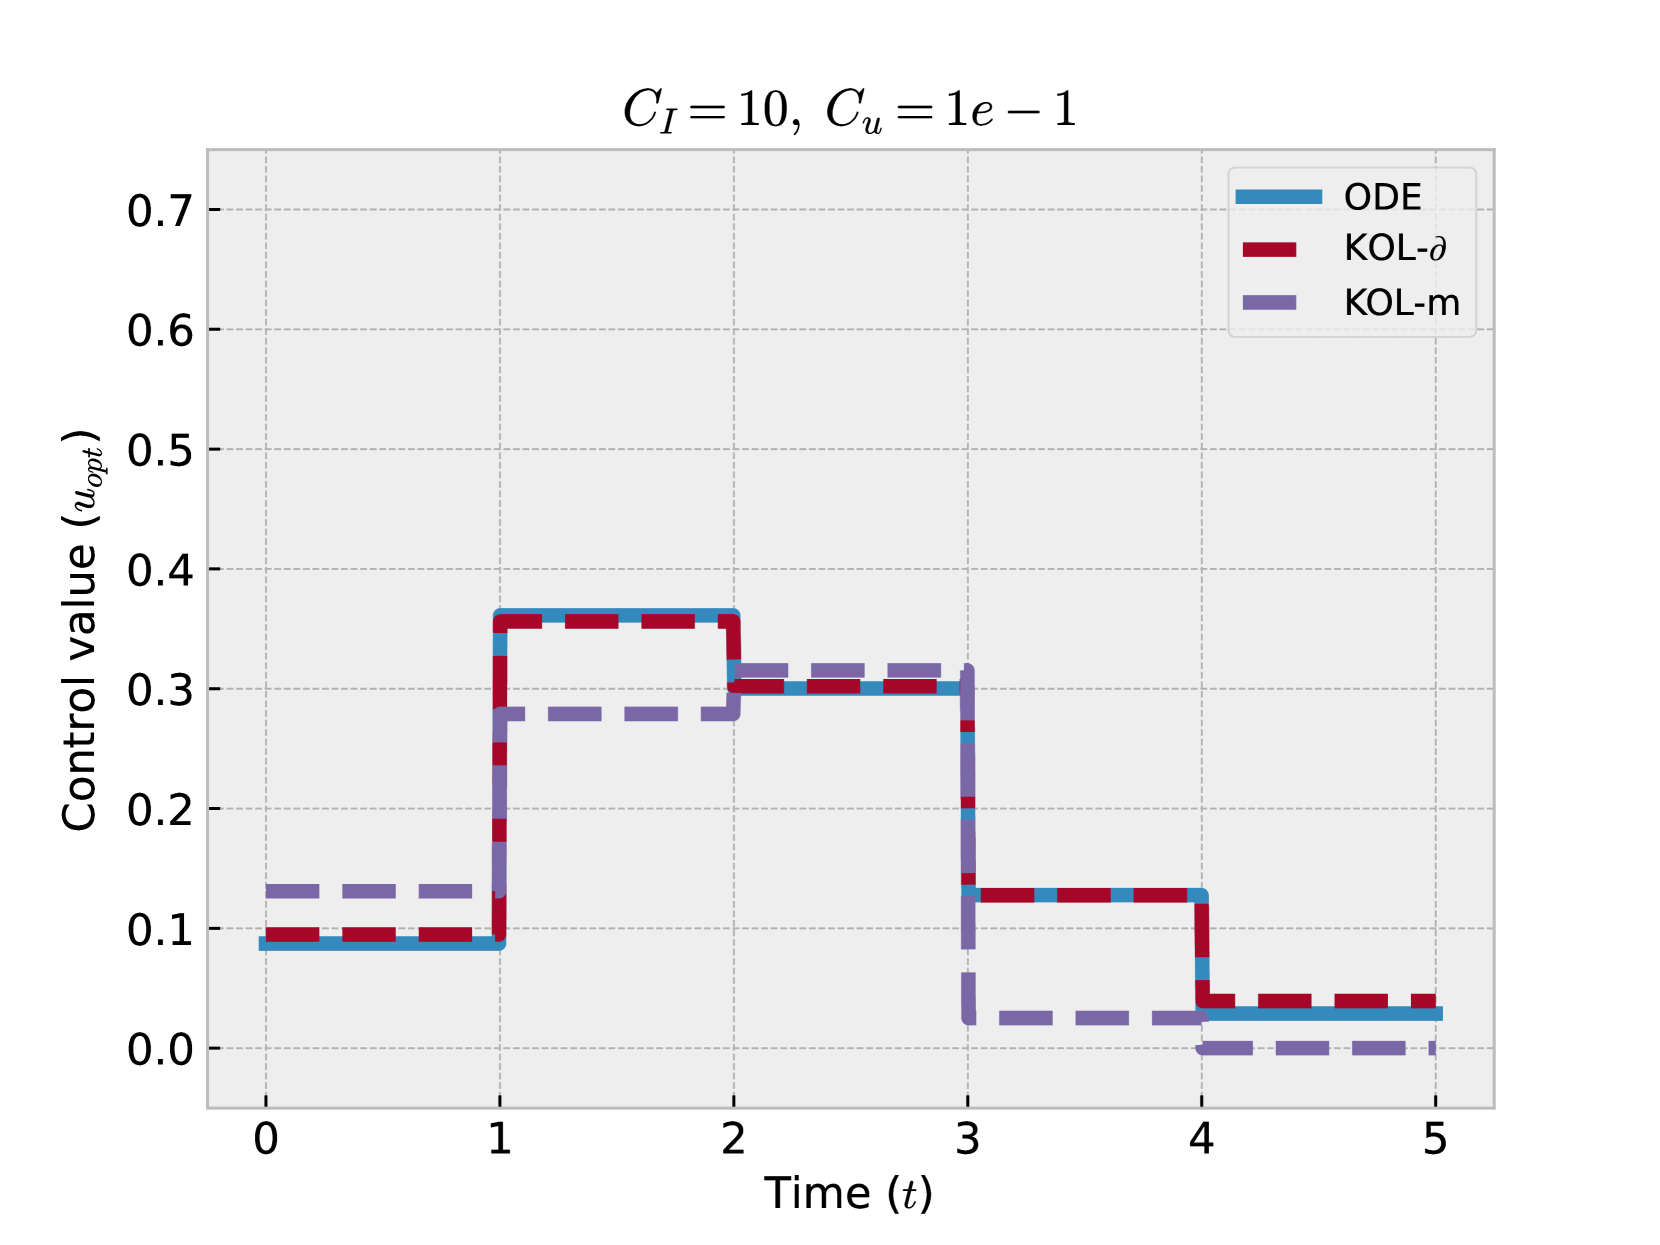
- **Title**: Control Value (u_opt) vs. Time (t)
- **System Parameters**:
- \( C_I = 10 \)
- \( C_u = 1e-1 \)
## Axes Labels and Scales
- **X-axis (Time, t)**:
- Range: 0 to 5
- Increment: 1
- **Y-axis (Control Value, u_opt)**:
- Range: 0.0 to 0.7
- Increment: 0.1
## Legend and Control Strategies
- **ODE** (Solid Blue Line)
- **KOL-δ** (Dashed Red Line)
- **KOL-m** (Dashed Purple Line)
## Key Trends and Data Points
### ODE (Solid Blue)
- **t=0**: 0.1
- **t=1**: Jumps to 0.35 (remains constant until t=2)
- **t=2**: Drops to 0.1 (remains constant until t=5)
### KOL-δ (Dashed Red)
- **t=0**: 0.1
- **t=1**: Jumps to 0.35 (remains constant until t=2)
- **t=2**: Drops to 0.1 (remains constant until t=3)
- **t=3**: Drops to 0.05 (remains constant until t=5)
### KOL-m (Dashed Purple)
- **t=0**: 0.1
- **t=1**: Jumps to 0.3 (remains constant until t=2)
- **t=2**: Drops to 0.1 (remains constant until t=3)
- **t=3**: Drops to 0.05 (remains constant until t=5)
## Chart Components
- **Grid Lines**: Dashed horizontal and vertical lines at 0.1 increments.
- **Line Styles**:
- Solid lines for ODE
- Dashed lines for KOL-δ and KOL-m
- **Legend Position**: Top-right corner
## Observations
1. All strategies start at a control value of 0.1 at t=0.
2. ODE maintains the highest control value (0.35) during t=1–2.
3. KOL-δ and KOL-m exhibit stepwise decreases in control value after t=2.
4. By t=5, ODE stabilizes at 0.1, while KOL-δ and KOL-m stabilize at 0.05.