# Technical Document Extraction: Receiver Operating Characteristic (ROC) Curve
## 1. Document Metadata
* **Title:** Receiver Operating Characteristic Curve (Test)
* **Type:** Line Graph / Performance Metric Chart
* **Language:** English
## 2. Component Isolation
### Header
* **Text:** "Receiver Operating Characteristic Curve (Test)"
* **Position:** Top-centered.
### Main Chart Area (Coordinate System)
* **Y-Axis Label:** TPR (True Positive Rate)
* **Y-Axis Scale:** 0.0 to 1.0 (increments of 0.2 marked, with grid lines at every 0.2 interval).
* **X-Axis Label:** FPR (False Positive Rate)
* **X-Axis Scale:** 0.0 to 1.0 (increments of 0.2 marked, with grid lines at every 0.2 interval).
* **Background:** Light gray with a white grid.
### Legend
* **Spatial Placement:** Bottom-right quadrant [approx. x=0.55 to 0.95, y=0.05 to 0.20].
* **Entry 1:** Solid dark blue line — "ROC curve (area = 0.73)"
* **Entry 2:** Dashed orange line — "Baseline"
---
## 3. Data Series Analysis and Trend Verification
### Series 1: Baseline
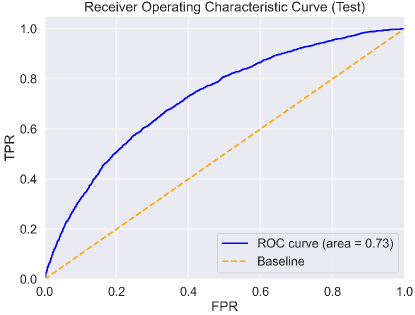
* **Visual Description:** A dashed orange line starting at the origin (0,0) and extending diagonally at a 45-degree angle to the top-right corner (1,1).
* **Trend:** Linear upward slope with a constant rate of change.
* **Significance:** Represents a random classifier (AUC = 0.50).
### Series 2: ROC Curve
* **Visual Description:** A solid dark blue curve that originates at (0,0), bows upward toward the top-left corner, and terminates at (1,1).
* **Trend:** Concave downward. The curve rises sharply at low FPR values and gradually flattens as it approaches an FPR of 1.0.
* **Key Data Points (Estimated):**
| Point | FPR (X-Axis) | TPR (Y-Axis) |
| :--- | :--- | :--- |
| Origin | 0.0 | 0.0 |
| Point A | ~0.1 | ~0.3 |
| Point B | ~0.2 | ~0.5 |
| Point C | ~0.4 | ~0.7 |
| Point D | ~0.6 | ~0.85 |
| Endpoint | 1.0 | 1.0 |
* **Metric:** The Area Under the Curve (AUC) is explicitly stated as **0.73**.
---
## 4. Summary of Information
This chart illustrates the performance of a binary classification model on a test dataset. The model's performance (blue line) is significantly better than a random guess (orange dashed line), as evidenced by the curve's position above the diagonal baseline.
The **AUC of 0.73** indicates a "fair" to "good" level of discrimination, meaning there is a 73% probability that the model will rank a randomly chosen positive instance higher than a randomly chosen negative one. The steepness of the curve at the beginning suggests the model maintains a relatively high True Positive Rate while keeping the False Positive Rate low in the initial threshold settings.