# Receiver Operating Characteristic Curve (Test)
## Key Components and Labels
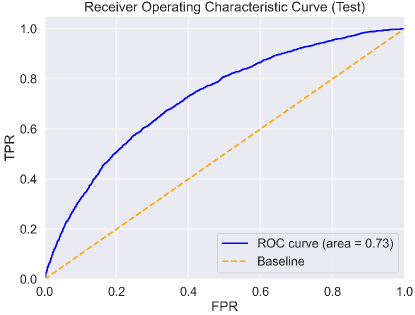
- **Title**: "Receiver Operating Characteristic Curve (Test)"
- **Y-Axis Label**: "TPR" (True Positive Rate)
- **X-Axis Label**: "FPR" (False Positive Rate)
- **Legend**:
- **Blue Solid Line**: "ROC curve (area = 0.73)"
- **Orange Dashed Line**: "Baseline"
## Axis Details
- **X-Axis (FPR)**:
- Range: 0.0 to 1.0
- Increment: 0.2
- **Y-Axis (TPR)**:
- Range: 0.0 to 1.0
- Increment: 0.2
## Line Trends
1. **ROC Curve (Blue Solid Line)**:
- **Trend**: Starts at (0.0, 0.0) and ascends to (1.0, 1.0), showing a smooth, upward curve.
- **Area Under Curve (AUC)**: 0.73 (as noted in the legend).
- **Performance**: Exceeds the baseline, indicating better classification performance than random guessing.
2. **Baseline (Orange Dashed Line)**:
- **Trend**: Straight diagonal line from (0.0, 0.0) to (1.0, 1.0), representing a random classifier.
- **Purpose**: Serves as a reference for evaluating the ROC curve's performance.
## Spatial Grounding
- **Legend Position**: Bottom-right corner of the chart.
- **Color Matching**:
- Blue solid line corresponds to "ROC curve (area = 0.73)".
- Orange dashed line corresponds to "Baseline".
## Component Isolation
1. **Header**: Contains the title "Receiver Operating Characteristic Curve (Test)".
2. **Main Chart**:
- Axes labeled "TPR" (y-axis) and "FPR" (x-axis).
- Two lines: ROC curve (blue) and baseline (orange).
3. **Footer**: Contains the legend with labels and colors.
## Additional Notes
- **Language**: All text is in English.
- **Data Representation**: The chart visually compares the performance of a classification model (ROC curve) against a random classifier (baseline). The AUC value of 0.73 suggests moderate performance, as values closer to 1.0 indicate better performance.