## Diagram: Data Replication and Reduction
### Overview
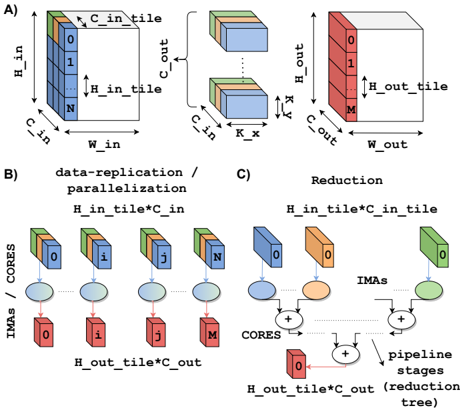
The image illustrates data replication and reduction techniques, likely in the context of parallel processing or hardware acceleration. It consists of three sections: A) a depiction of data tiling, B) a diagram of data replication/parallelization, and C) a diagram of a reduction operation.
### Components/Axes
**Section A: Data Tiling**
* **Left Cube:** Represents input data.
* Dimensions: H_in (height), W_in (width), C_in (channels).
* Tiling: Shows H_in_tile (height of tile), C_in_tile (channels of tile).
* Labels on the side indicate indices 0, 1, and N.
* **Middle Cubes:** Represent the tiled data.
* Dimensions: C_in (channels), K_x (kernel width).
* C_out is indicated with a double arrow.
* **Right Cube:** Represents output data.
* Dimensions: H_out (height), W_out (width), C_out (channels).
* Tiling: Shows H_out_tile (height of tile).
* Labels on the side indicate indices 0, 1, and M.
* K_y is indicated with a double arrow.
**Section B: Data Replication/Parallelization**
* **Top Row:** Shows data tiles, colored blue, orange, and green.
* Labels: 0, i, j, N.
* Formula: H_in_tile * C_in
* **Middle Row:** Shows blue ovals, representing processing units.
* **Bottom Row:** Shows output tiles, colored red.
* Labels: 0, i, j, M.
* Formula: H_out_tile * C_out
* Labels: IMAs / CORES
**Section C: Reduction**
* **Top Row:** Shows data tiles, colored blue, orange, and green.
* Labels: 0, 0, 0.
* Formula: H_in_tile * C_in_tile
* **Middle Row:** Shows "+" symbols within circles, representing addition operations.
* **Bottom Row:** Shows output tile, colored red.
* Label: 0.
* Formula: H_out_tile * C_out
* Labels: IMAs, CORES, pipeline stages (reduction tree)
### Detailed Analysis
**Section A:**
* The input data is divided into tiles of size H_in_tile x C_in_tile.
* The output data is divided into tiles of size H_out_tile.
* The middle cubes show the kernel with dimensions C_in x K_x.
**Section B:**
* The data tiles are replicated and processed in parallel by multiple processing units (IMAs/CORES).
* Each processing unit produces an output tile.
* The number of processing units is likely related to the number of input tiles.
**Section C:**
* The data tiles are reduced using a tree-like structure of addition operations.
* The output of each addition operation is fed into the next stage of the reduction tree.
* The final output is a single tile.
### Key Observations
* The image illustrates two common techniques for parallel processing: data replication/parallelization and reduction.
* Data tiling is used to divide the input and output data into smaller chunks.
* The reduction operation is implemented using a tree-like structure, which allows for efficient parallel computation.
### Interpretation
The image demonstrates how data can be processed in parallel using data replication and reduction techniques. Data tiling is used to divide the input and output data into smaller chunks, which can be processed independently. Data replication allows multiple processing units to work on different parts of the data simultaneously. Reduction is used to combine the results of the parallel processing into a single output. These techniques are commonly used in hardware accelerators and parallel processing systems to improve performance.