## Line Chart: Reward vs Steps (Mean Min/Max)
### Overview
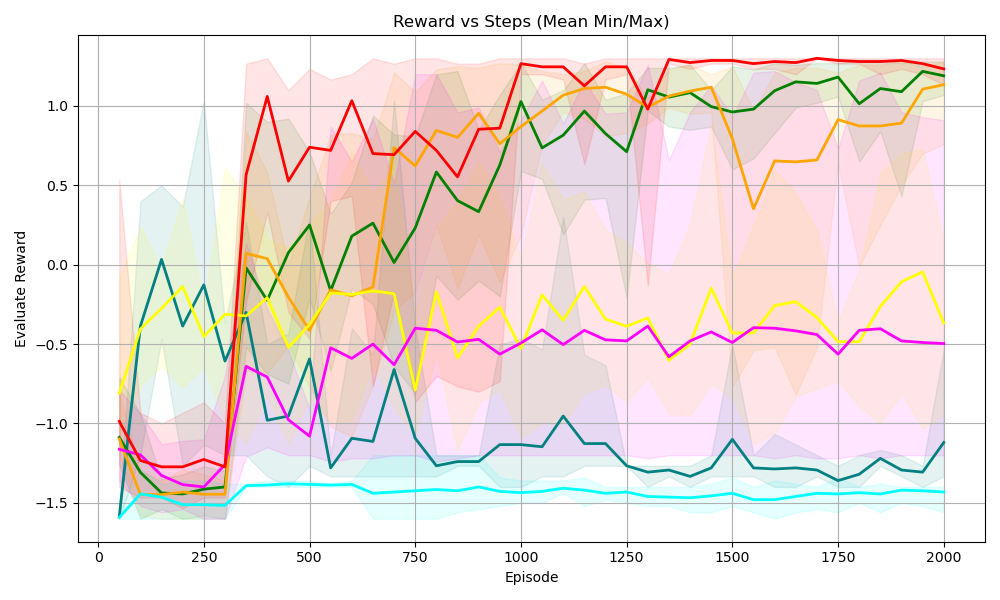
The chart visualizes the performance of multiple reinforcement learning algorithms over 2000 episodes, tracking their evaluation rewards. Each algorithm is represented by a colored line with a shaded region indicating the minimum and maximum reward variability. The x-axis represents episodes (0–2000), and the y-axis represents evaluation reward (-1.5 to 1.0).
### Components/Axes
- **Title**: "Reward vs Steps (Mean Min/Max)"
- **X-axis**: "Episode" (0–2000, increments of 250)
- **Y-axis**: "Evaluation Reward" (-1.5 to 1.0, increments of 0.5)
- **Legend**: Located in the top-right corner, mapping colors to algorithms:
- Red: PPO
- Green: SAC
- Yellow: DQN
- Blue: TD3
- Pink: A2C
- Cyan: DDPG
### Detailed Analysis
1. **PPO (Red Line)**:
- Starts near -1.0 at episode 0.
- Sharp upward spike to ~1.0 by episode 250.
- Stabilizes with minor fluctuations around 1.0 after episode 500.
- Shaded region narrows significantly after episode 500, indicating reduced variability.
2. **SAC (Green Line)**:
- Begins at ~-1.0, gradually increases to ~1.0 by episode 1500.
- Consistent upward trend with moderate fluctuations.
- Shaded region widens initially but stabilizes after episode 1000.
3. **DQN (Yellow Line)**:
- Starts at ~-1.0, fluctuates between -0.5 and 0.5 until episode 500.
- Sharp rise to ~1.0 by episode 1000, followed by stabilization.
- Shaded region remains broad throughout, suggesting high variability.
4. **TD3 (Blue Line)**:
- Begins at ~-1.0, peaks at ~0.5 around episode 750.
- Declines to ~-0.5 by episode 1500, then stabilizes.
- Shaded region is narrowest during the peak phase.
5. **A2C (Pink Line)**:
- Starts at ~-1.0, fluctuates between -0.5 and 0.0 until episode 1000.
- Gradual increase to ~-0.2 by episode 2000.
- Shaded region is moderately wide, indicating persistent variability.
6. **DDPG (Cyan Line)**:
- Remains the lowest-performing algorithm, hovering near -1.5 throughout.
- Minimal upward trend, peaking at ~-1.2 by episode 2000.
- Shaded region is consistently narrow, suggesting low variability.
### Key Observations
- **PPO and SAC** achieve the highest rewards, with SAC showing the most consistent improvement.
- **TD3** exhibits a notable peak but later underperforms compared to other algorithms.
- **DDPG** consistently lags behind, with the lowest rewards and minimal improvement.
- Shaded regions indicate that variability decreases for most algorithms after ~500 episodes, except DQN.
### Interpretation
The chart demonstrates that **PPO** and **SAC** are the most effective algorithms for this task, with SAC showing steady progress and PPO achieving rapid early gains. **TD3**'s initial success followed by decline suggests sensitivity to hyperparameters or environment dynamics. **DQN**'s high variability implies instability in training. **DDPG**'s poor performance highlights potential limitations in its design for this specific problem. The narrowing shaded regions over time suggest that most algorithms stabilize their performance after initial exploration phases.