\n
## Bar Charts: Relative Memory Usage and Relative Train Time vs. FLOPS
### Overview
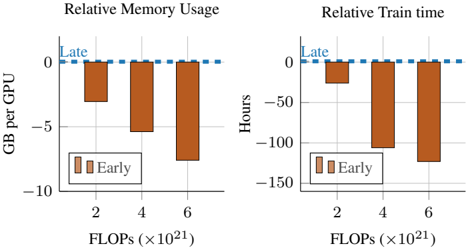
The image presents two bar charts side-by-side. The left chart displays "Relative Memory Usage" (in GB per GPU) against "FLOPS (x 10^21)". The right chart shows "Relative Train Time" (in Hours) against the same "FLOPS" scale. Both charts compare data categorized as "Early" and "Late". A horizontal dashed blue line at y=0 is present in both charts, serving as a reference point.
### Components/Axes
* **X-axis (Both Charts):** FLOPS (x 10^21), with markers at 2, 4, and 6.
* **Y-axis (Left Chart):** Relative Memory Usage (GB per GPU), ranging from -10 to 0.
* **Y-axis (Right Chart):** Relative Train Time (Hours), ranging from -150 to 0.
* **Legend (Both Charts):**
* "Early" - Represented by a light orange color.
* "Late" - Represented by a darker orange color.
* **Reference Line (Both Charts):** A horizontal dashed blue line at y=0.
### Detailed Analysis or Content Details
**Left Chart: Relative Memory Usage**
* **Early:**
* At 2 FLOPS (x 10^21): Approximately -2.5 GB per GPU.
* At 4 FLOPS (x 10^21): Approximately -6.5 GB per GPU.
* At 6 FLOPS (x 10^21): Approximately -2.5 GB per GPU.
* **Late:**
* At 2 FLOPS (x 10^21): Approximately -1.0 GB per GPU.
* At 4 FLOPS (x 10^21): Approximately -1.0 GB per GPU.
* At 6 FLOPS (x 10^21): Approximately -0.5 GB per GPU.
The "Early" bars consistently show more negative memory usage than the "Late" bars across all FLOPS values. The "Early" memory usage decreases from 2 to 4 FLOPS, then increases again at 6 FLOPS.
**Right Chart: Relative Train Time**
* **Early:**
* At 2 FLOPS (x 10^21): Approximately -25 Hours.
* At 4 FLOPS (x 10^21): Approximately -60 Hours.
* At 6 FLOPS (x 10^21): Approximately -100 Hours.
* **Late:**
* At 2 FLOPS (x 10^21): Approximately -15 Hours.
* At 4 FLOPS (x 10^21): Approximately -50 Hours.
* At 6 FLOPS (x 10^21): Approximately -80 Hours.
The "Early" train time is consistently more negative (longer) than the "Late" train time across all FLOPS values. The "Early" train time decreases (becomes more negative) as FLOPS increase.
### Key Observations
* Both charts demonstrate a clear difference between "Early" and "Late" categories.
* "Early" consistently exhibits more negative values for both memory usage and train time, indicating a greater reduction or longer duration relative to the zero baseline.
* The "Early" memory usage shows a non-monotonic trend, decreasing then increasing with FLOPS.
* The "Early" train time shows a consistent decrease (more negative) with increasing FLOPS.
### Interpretation
The data suggests that the "Early" phase of whatever process is being measured (likely model training) requires significantly more memory and takes considerably longer than the "Late" phase. The decreasing train time with increasing FLOPS in the "Early" phase indicates that increasing computational power (FLOPS) leads to faster training in that phase. The non-monotonic memory usage trend in the "Early" phase could indicate a complex relationship between FLOPS and memory requirements, potentially due to optimization strategies or changing data characteristics during training. The horizontal line at y=0 suggests that the values are relative to a baseline, and negative values represent a reduction or longer duration compared to that baseline. The charts likely represent a comparison of two different training strategies or phases of a single strategy, with "Early" representing an initial, more resource-intensive phase and "Late" representing a refined, more efficient phase.