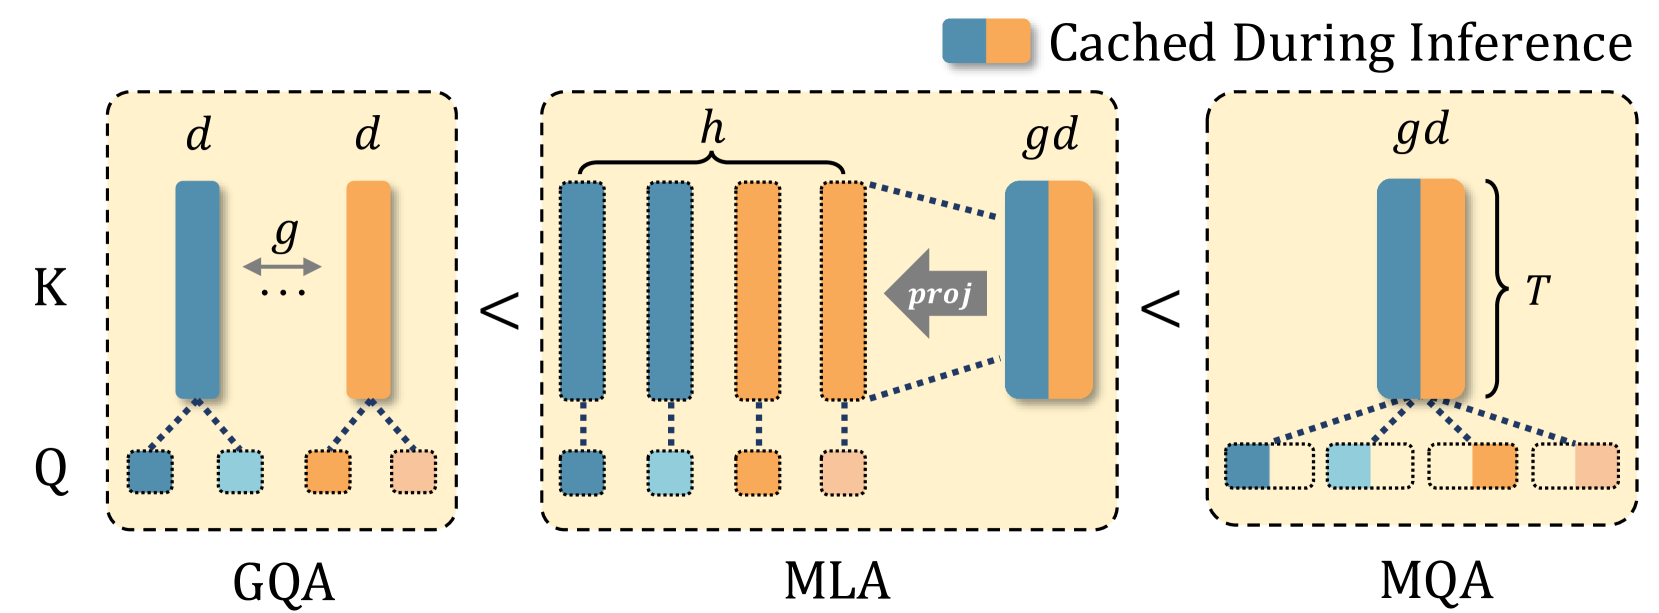
## Diagram: Query Processing Methods Comparison (GQA, MLA, MQA)
### Overview
The diagram illustrates three query processing architectures (GQA, MLA, MQA) using colored rectangles and arrows to represent data flow and caching mechanisms. Blue and orange colors denote cached data during inference, with dashed lines indicating connections between components.
### Components/Axes
- **Legend**:
- Top-right corner:
- Blue rectangle labeled "Cached During Inference"
- Orange rectangle labeled "Cached During Inference"
- **GQA Section** (Leftmost):
- Dashed box containing:
- Vertical blue rectangle labeled "K"
- Vertical orange rectangle labeled "d"
- Horizontal arrow labeled "g" between K and d
- Three small squares below K (blue, light blue, orange)
- **MLA Section** (Center):
- Dashed box containing:
- Three vertical blue rectangles labeled "h"
- Three vertical orange rectangles labeled "gd"
- Projection arrow labeled "proj" between h and gd
- Three small squares below h (blue, light blue, orange)
- **MQA Section** (Rightmost):
- Dashed box containing:
- Vertical blue/orange split rectangle labeled "gd"
- Vertical orange rectangle labeled "T"
- Three small squares below gd (blue/white, white/orange, white/orange)
### Spatial Grounding
- Legend: Top-right corner
- GQA: Leftmost section
- MLA: Center section
- MQA: Rightmost section
- Arrows flow left-to-right between sections
### Detailed Analysis
1. **GQA**:
- Basic architecture with direct connection between K (blue) and d (orange)
- Three small squares below K suggest input/query components
- No intermediate processing steps shown
2. **MLA**:
- Introduces hierarchical processing with three "h" (blue) and "gd" (orange) components
- Projection arrow ("proj") indicates transformation between layers
- Maintains three input components below h
3. **MQA**:
- Combines gd (blue/orange split) with T (orange)
- Three output components below gd show mixed caching states
- Final architecture appears most complex with additional processing step (T)
### Key Observations
1. Caching mechanism evolves from simple (GQA) to complex (MQA)
2. Blue consistently represents query-related components (K, h, gd)
3. Orange represents data/cache components (d, gd, T)
4. MQA shows split caching (blue/white) in final components
5. Projection arrow in MLA suggests intermediate data transformation
### Interpretation
The diagram demonstrates a progression in query processing complexity:
1. **GQA** represents a baseline architecture with direct key-value storage
2. **MLA** introduces hierarchical processing with intermediate transformations
3. **MQA** combines caching and final processing steps, showing mixed caching states
The color coding reveals:
- Blue components maintain query context throughout processing
- Orange components represent cached data that persists through inference
- MQA's split caching (blue/white) suggests partial data retention or state transitions
This visualization likely represents attention mechanisms in transformer architectures, where:
- K = Keys
- Q = Queries
- d = Values
- h = Attention heads
- gd = Cached attention scores
- T = Final output threshold or token