TECHNICAL ASSET FINGERPRINT
cc9a11d5f9b565eace125d84
Click to view fullscreen
Press ESC or click to close
FOUND IN PAPERS
EXPERT: healer-alpha-free VERSION 1
RUNTIME: free/openrouter/healer-alpha
INTEL_VERIFIED
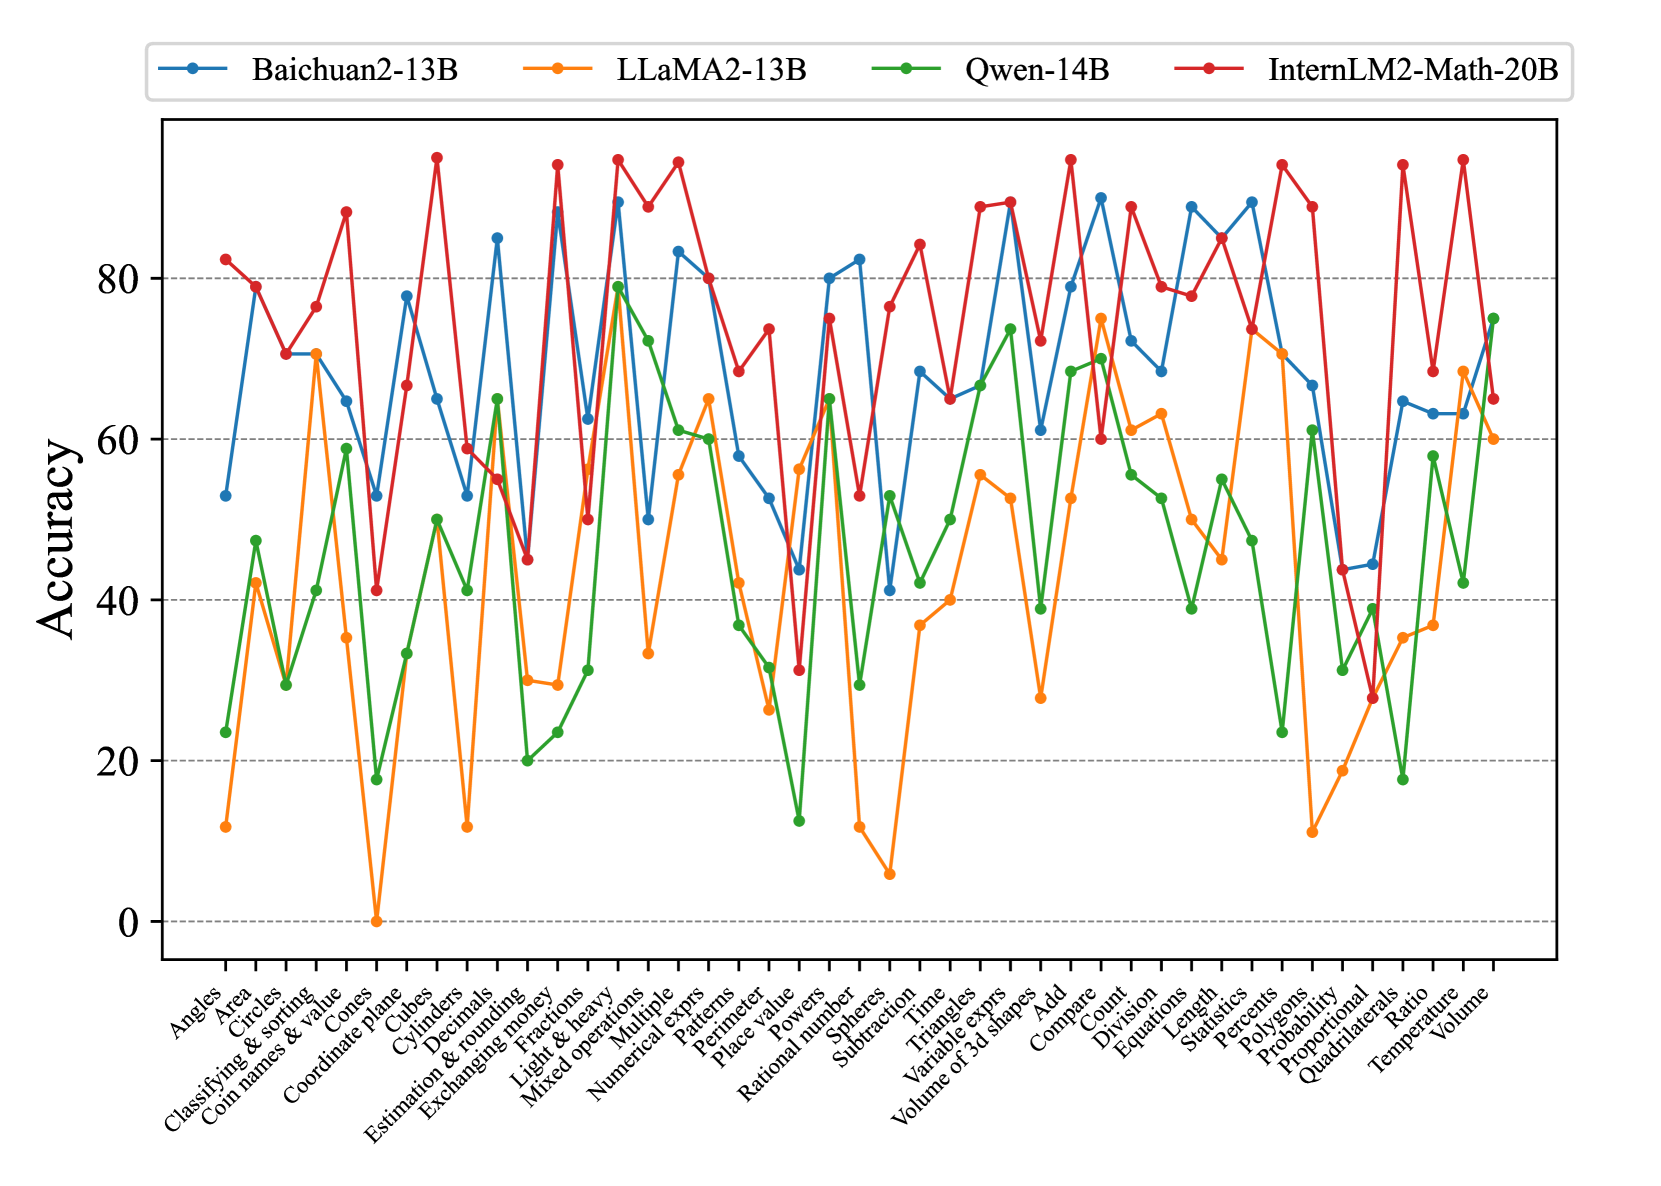
## Line Chart: Accuracy of Four Language Models Across Mathematical Categories
### Overview
This image is a line chart comparing the performance accuracy of four different large language models (LLMs) across a wide range of mathematical problem categories. The chart displays how each model's accuracy varies significantly depending on the specific type of math problem.
### Components/Axes
* **Chart Type:** Multi-series line chart with markers.
* **Y-Axis:** Labeled "Accuracy". The scale runs from 0 to approximately 95, with major gridlines at intervals of 20 (0, 20, 40, 60, 80).
* **X-Axis:** Lists 43 distinct mathematical categories. The labels are rotated approximately 45 degrees for readability. The categories are, from left to right:
1. Angles
2. Area
3. Circles
4. Classifying & sorting
5. Coin names & value
6. Cones
7. Coordinate plane
8. Cubes
9. Cylinders
10. Decimals
11. Estimation & rounding
12. Exchanging money
13. Fractions
14. Light & heavy
15. Mixed operations
16. Multiple
17. Numerical exprs
18. Patterns
19. Perimeter
20. Place value
21. Powers
22. Rational number
23. Spheres
24. Subtraction
25. Time
26. Triangles
27. Variable exprs
28. Volume of 3d shapes
29. Add
30. Compare
31. Count
32. Division
33. Equations
34. Length
35. Statistics
36. Percents
37. Polygons
38. Probability
39. Proportional
40. Quadrilaterals
41. Ratio
42. Temperature
43. Volume
* **Legend:** Positioned at the top center of the chart. It defines four data series:
* **Baichuan2-13B:** Blue line with circular markers.
* **LLaMA2-13B:** Orange line with circular markers.
* **Qwen-14B:** Green line with circular markers.
* **InternLM2-Math-20B:** Red line with circular markers.
### Detailed Analysis
The chart shows high variability in performance for all models across the 43 categories. Below is a summary of trends and approximate accuracy values for each model.
**1. Baichuan2-13B (Blue Line):**
* **Trend:** Highly volatile, with frequent sharp peaks and troughs. Often performs in the middle-to-high range but has significant dips.
* **Notable Highs:** Fractions (~90), Mixed operations (~83), Numerical exprs (~82), Add (~90), Equations (~88), Percents (~88).
* **Notable Lows:** Coordinate plane (~53), Subtraction (~41), Probability (~44), Quadrilaterals (~44).
**2. LLaMA2-13B (Orange Line):**
* **Trend:** Generally the lowest-performing model across most categories, with the most extreme low values. Shows a few moderate peaks.
* **Notable Highs:** Circles (~70), Fractions (~78), Mixed operations (~65), Add (~75), Compare (~61), Count (~63).
* **Notable Lows:** Coordinate plane (~0), Cubes (~12), Subtraction (~6), Probability (~11), Quadrilaterals (~35).
**3. Qwen-14B (Green Line):**
* **Trend:** Performance is often in the middle range, below Baichuan2 and InternLM2 but above LLaMA2. Shows a distinct pattern of peaks and valleys.
* **Notable Highs:** Fractions (~79), Mixed operations (~72), Numerical exprs (~61), Add (~74), Compare (~69), Volume (~75).
* **Notable Lows:** Coordinate plane (~18), Cubes (~33), Subtraction (~13), Probability (~23), Quadrilaterals (~18).
**4. InternLM2-Math-20B (Red Line):**
* **Trend:** Frequently the top-performing model, especially in arithmetic and algebraic categories. Its line is often at the top of the chart, though it has sharp drops in geometry and measurement topics.
* **Notable Highs:** Fractions (~94), Mixed operations (~94), Numerical exprs (~80), Add (~94), Equations (~84), Percents (~94), Ratio (~94).
* **Notable Lows:** Coordinate plane (~41), Cubes (~59), Subtraction (~53), Probability (~28), Quadrilaterals (~28).
**Cross-Model Comparison by Category Type:**
* **Arithmetic & Algebra (e.g., Fractions, Mixed operations, Add, Equations):** InternLM2-Math-20B and Baichuan2-13B consistently lead, often scoring above 80. LLaMA2-13B lags significantly.
* **Geometry & Measurement (e.g., Coordinate plane, Cubes, Spheres, Volume of 3d shapes):** Performance is more mixed and generally lower for all models. No single model dominates. For "Coordinate plane," all models score below 55, with LLaMA2 at ~0.
* **Basic Concepts (e.g., Count, Compare, Classifying & sorting):** Models show relatively closer performance, though InternLM2 and Baichuan2 still tend to be higher.
### Key Observations
1. **Model Specialization:** InternLM2-Math-20B shows a clear strength in core mathematical operations (fractions, mixed operations, equations, percents, ratio), suggesting specialized training or fine-tuning for these areas.
2. **Universal Difficulty:** Certain categories prove challenging for all models. "Coordinate plane" and "Probability" see low scores across the board, indicating these are harder reasoning tasks for current LLMs.
3. **Extreme Volatility:** The performance of each model is not consistent; it is highly dependent on the specific problem category. A model can be near the top in one category and near the bottom in another.
4. **LLaMA2-13B's Struggles:** The LLaMA2-13B model has the weakest overall performance, with several categories near or at 0% accuracy, suggesting a potential lack of relevant training data or capability for those specific math skills.
### Interpretation
This chart provides a diagnostic breakdown of LLM capabilities in mathematical reasoning. It moves beyond an "average accuracy" score to reveal a nuanced landscape of strengths and weaknesses.
* **What the data suggests:** Mathematical reasoning in LLMs is not a monolithic skill. Proficiency is highly fragmented across different domains. A model's overall benchmark score would mask these critical variations.
* **How elements relate:** The x-axis categories represent a taxonomy of elementary to middle-school math skills. The diverging lines show that model architecture and training data create distinct "profiles" of competency. For instance, InternLM2-Math-20B's profile is spiked in arithmetic/algebra, while its geometry performance is more average.
* **Notable anomalies:** The near-zero score for LLaMA2-13B on "Coordinate plane" is a stark outlier, suggesting a complete failure mode for that model on that specific task type. The consistent high performance of InternLM2-Math-20B on categories involving fractions, percents, and ratios indicates a possible targeted optimization for proportional reasoning.
* **Implication:** For practical applications, one cannot assume a model good at "math" is good at *all* math. Task-specific evaluation is crucial. The chart also highlights areas (like probability and coordinate geometry) where all current models need significant improvement, guiding future research and training efforts.
DECODING INTELLIGENCE...