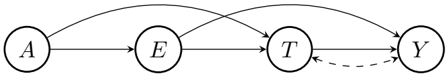
## Causal Diagram: Directed Acyclic Graph
### Overview
The image presents a directed acyclic graph (DAG) illustrating causal relationships between variables A, E, T, and Y. The diagram uses nodes (circles) to represent variables and arrows to represent causal influences. A dashed arrow indicates a potential feedback loop or a weaker/less certain causal link.
### Components/Axes
* **Nodes:**
* A: Variable A, positioned on the left.
* E: Variable E, positioned to the right of A.
* T: Variable T, positioned to the right of E.
* Y: Variable Y, positioned on the rightmost side.
* **Edges (Arrows):**
* Solid arrows indicate direct causal effects.
* A dashed arrow indicates a potential feedback loop or a weaker/less certain causal link.
### Detailed Analysis or ### Content Details
* **Causal Relationships:**
* A -> E: Variable A has a direct causal effect on variable E.
* A -> T: Variable A has a direct causal effect on variable T (represented by a curved arrow).
* A -> Y: Variable A has a direct causal effect on variable Y (represented by a curved arrow).
* E -> T: Variable E has a direct causal effect on variable T.
* T -> Y: Variable T has a direct causal effect on variable Y.
* Y --> T: Variable Y has a potential causal effect on variable T (represented by a dashed arrow).
### Key Observations
* Variable A influences all other variables (E, T, and Y) either directly or indirectly.
* Variable E influences variables T and Y.
* Variable T influences variable Y and potentially is influenced by variable Y.
* The dashed arrow from Y to T suggests a feedback loop or a potential reverse causality.
### Interpretation
The diagram represents a causal model where variable A is a root cause, influencing E, T, and Y. Variable E mediates the effect of A on T. Variable T directly influences Y, and there's a potential feedback loop from Y back to T. This model could represent various real-world scenarios where A is an initial condition, E is an intermediate factor, T is a treatment or intervention, and Y is the outcome. The dashed arrow indicates a possible confounding factor or a more complex relationship between T and Y that requires further investigation.