## Diagram: Causal Graph with Feedback Loop
### Overview
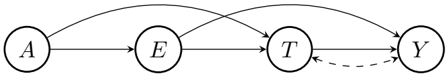
This image displays a directed graph, commonly known as a causal diagram or Bayesian network, illustrating relationships between four distinct variables or entities labeled A, E, T, and Y. The diagram consists of nodes (circles containing letters) and directed edges (arrows) indicating the flow of influence or causality. Both solid and dashed arrows are used, suggesting different types or strengths of relationships.
### Components/Axes
The diagram is composed of four circular nodes, each containing a single uppercase letter, arranged horizontally from left to right with some vertical displacement for clarity.
* **Node A:** Positioned on the far left.
* **Node E:** Positioned to the right of A, slightly below the horizontal alignment of A.
* **Node T:** Positioned to the right of E, slightly below the horizontal alignment of E.
* **Node Y:** Positioned on the far right, slightly above the horizontal alignment of T.
The connections between these nodes are represented by directed arrows, indicating the direction of influence:
* **Solid Arrows:** Represent direct relationships.
* **Dashed Arrow:** Represents a distinct type of relationship, possibly a feedback loop or a different causal mechanism.
### Detailed Analysis
The relationships between the nodes are as follows:
1. **From Node A:**
* A straight, solid arrow points from Node A to Node E. This indicates a direct influence from A to E.
* A curved, solid arrow originates from Node A, arches upwards, and points to Node T. This indicates a direct influence from A to T, bypassing E.
2. **From Node E:**
* A straight, solid arrow points from Node E to Node T. This indicates a direct influence from E to T.
* A curved, solid arrow originates from Node E, arches upwards, and points to Node Y. This indicates a direct influence from E to Y, bypassing T.
3. **From Node T:**
* A straight, solid arrow points from Node T to Node Y. This indicates a direct influence from T to Y.
4. **From Node Y:**
* A curved, dashed arrow originates from Node Y, arches downwards, and points back to Node T. This indicates a feedback or reverse influence from Y to T, distinct from the other relationships due to its dashed line style.
### Key Observations
* **Multiple Paths:** Node A influences both E and T directly. Node E influences both T and Y directly.
* **Sequential Flow:** There's a general left-to-right flow of influence (A -> E -> T -> Y).
* **Bypassing Paths:** A influences T directly, bypassing E. E influences Y directly, bypassing T.
* **Feedback Loop:** A unique dashed arrow indicates a feedback mechanism from Y back to T. This is the only dashed arrow and the only arrow pointing from right to left, creating a loop.
* **Types of Arrows:** The consistent use of solid arrows for most forward influences and a single dashed arrow for the feedback loop suggests a distinction in the nature of these relationships. Curved arrows are used to avoid overlapping straight lines or to denote specific pathways.
### Interpretation
This diagram represents a system of interconnected variables, likely in a causal inference context.
* **A** appears to be an initial or exogenous variable, influencing downstream variables E and T. It could be an exposure, an intervention, or a baseline characteristic.
* **E** acts as a mediator or an intermediate variable, influenced by A and subsequently influencing T and Y.
* **T** is a central variable, influenced by A and E, and in turn influencing Y. It could represent a treatment, a target variable, or an outcome that is also a precursor to Y.
* **Y** is the ultimate outcome variable, influenced by E and T.
The **solid arrows** typically denote direct causal effects or strong, confirmed relationships. For example, A directly affects E, A directly affects T, E directly affects T, E directly affects Y, and T directly affects Y.
The **dashed arrow** from Y back to T is particularly notable. In causal diagrams, dashed lines can represent:
1. **Unmeasured confounding:** An unobserved common cause of Y and T.
2. **Feedback loop:** Y influences T, which then influences Y again (though in this specific diagram, the arrow is only Y -> T, not T -> Y -> T). This suggests that the outcome Y might, in turn, affect the treatment or intermediate variable T. This could imply a dynamic system or a situation where the "outcome" influences subsequent "treatment" decisions or states.
3. **Hypothetical or uncertain relationship:** A relationship that is suspected but not yet confirmed or is of a different nature than the solid arrows.
The presence of multiple paths (e.g., A -> E -> T -> Y vs. A -> T -> Y) suggests potential for mediation analysis, where the effect of A on Y could be mediated through E and T. Similarly, the effect of E on Y could be mediated through T.
The feedback loop (Y -> T) is critical. If this represents a true causal feedback, it complicates standard causal inference methods that assume acyclic graphs. It implies that the state of Y can influence the state of T, which then influences Y again through the T -> Y path. This could be indicative of a dynamic system where outcomes feed back into inputs, or a scenario where the "treatment" (T) is adjusted based on the "outcome" (Y). Without further context, the exact nature of the dashed line remains open to interpretation, but it clearly signifies a relationship distinct from the primary forward causal paths.