\n
## Directed Graph Diagram: System Component Relationships
### Overview
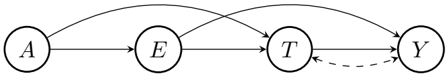
The image displays a directed graph (flowchart) consisting of four circular nodes labeled with single letters, connected by a series of solid and dashed arrows. The diagram illustrates the directional relationships and potential feedback loops between four components or states within a system.
### Components/Axes
* **Nodes (Components):** Four circular nodes, each containing a single capital letter. From left to right, they are labeled:
* **A**
* **E**
* **T**
* **Y**
* **Edges (Connections):** The relationships are depicted by arrows. There are two distinct types:
* **Solid Arrows:** Indicate a primary or direct relationship/flow.
* **Dashed Arrow:** Indicates a secondary, conditional, or feedback relationship.
### Detailed Analysis
The connections between the nodes are as follows:
1. **From Node A:**
* A solid arrow points directly to the right, connecting to **Node E**.
* A second solid arrow originates from the top of Node A, curves upwards and to the right over Node E, and terminates at **Node T**.
2. **From Node E:**
* A solid arrow points directly to the right, connecting to **Node T**.
* A second solid arrow originates from the top of Node E, curves upwards and to the right over Node T, and terminates at **Node Y**.
3. **From Node T:**
* A solid arrow points directly to the right, connecting to **Node Y**.
* A **dashed arrow** originates from the right side of Node T, curves downwards and back to the left, and terminates at the bottom of **Node T itself**, forming a self-referential loop.
4. **From Node Y:**
* Node Y is a terminal node in this diagram; no arrows originate from it.
**Spatial Grounding:** The nodes are arranged in a horizontal line. The curved arrows (A→T and E→Y) are positioned above the straight-line arrows, creating a layered visual hierarchy. The dashed self-loop on Node T is positioned below the node.
### Key Observations
* **Convergent Flow:** Node T receives inputs from both A and E. Node Y receives inputs from both E and T.
* **Feedback Mechanism:** The dashed self-loop on Node T is the only feedback mechanism shown, suggesting a process that can influence or modify its own state.
* **Pathways:** There are multiple pathways to reach Node Y: directly from E, directly from T, or indirectly via A→E→Y or A→T→Y.
* **Source and Sink:** Node A is the sole source (only outgoing arrows). Node Y is the sole sink (only incoming arrows).
### Interpretation
This diagram models a system with four key components (A, E, T, Y) where influence or data flows primarily from left to right. The structure suggests a process where an initial state or input (A) affects intermediate stages (E and T), which then determine the final output or state (Y).
The **dashed self-loop on T** is the most significant analytical feature. It implies that component T has a recursive or iterative function—it can process its own output, which may represent a calculation loop, a state that persists or decays, or a quality that is self-reinforcing or self-correcting. The solid arrows represent the main causal or sequential pathways, while the dashed arrow represents a different class of relationship, possibly internal processing, memory, or a regulatory feedback loop.
The multiple converging paths to Y indicate that the final outcome is influenced by several factors and is not determined by a single linear sequence. This could model a decision-making system, a biological pathway, a computational process, or a organizational workflow where T's self-referential activity is a critical moderating step before producing the final result Y.