## Line Charts: Trade-off between Exploitability and Social Welfare
### Overview
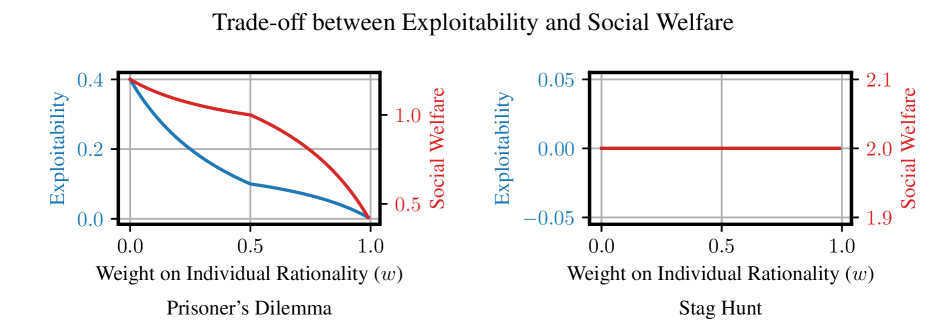
The image contains two line charts comparing the relationship between **Exploitability** and **Social Welfare** across two game theory scenarios: **Prisoner's Dilemma** (left) and **Stag Hunt** (right). Both charts use **Weight on Individual Rationality (w)** as the independent variable (x-axis) and plot two metrics: **Exploitability** (blue line) and **Social Welfare** (red line). The charts illustrate how these metrics interact as the weight on individual rationality changes.
---
### Components/Axes
#### Shared Elements
- **X-axis**: "Weight on Individual Rationality (w)" with values ranging from **0.0 to 1.0**.
- **Y-axis (Left)**:
- **Prisoner's Dilemma**: "Exploitability" (0.0 to 0.4) and "Social Welfare" (0.5 to 1.0).
- **Stag Hunt**: "Exploitability" (-0.05 to 0.05) and "Social Welfare" (1.9 to 2.1).
- **Legends**:
- Both charts use a **red line** for **Social Welfare** and a **blue line** for **Exploitability**.
- Legends are positioned on the **right side** of each chart.
#### Prisoner's Dilemma Chart
- **X-axis**: 0.0 to 1.0 (linear scale).
- **Y-axis (Left)**:
- **Exploitability**: 0.0 to 0.4 (blue line).
- **Social Welfare**: 0.5 to 1.0 (red line).
- **Lines**:
- **Red (Social Welfare)**: Starts at ~0.4 when w=0.0, decreases to ~0.5 when w=1.0.
- **Blue (Exploitability)**: Starts at ~0.4 when w=0.0, decreases to ~0.0 when w=1.0.
#### Stag Hunt Chart
- **X-axis**: 0.0 to 1.0 (linear scale).
- **Y-axis (Left)**:
- **Exploitability**: -0.05 to 0.05 (blue line).
- **Social Welfare**: 1.9 to 2.1 (red line).
- **Lines**:
- **Red (Social Welfare)**: Flat line at ~2.0 across all w values.
- **Blue (Exploitability)**: Flat line at ~0.0 across all w values.
---
### Detailed Analysis
#### Prisoner's Dilemma
- **Exploitability (Blue)**:
- Decreases monotonically from ~0.4 (w=0.0) to ~0.0 (w=1.0).
- Slope: Approximately linear.
- **Social Welfare (Red)**:
- Decreases monotonically from ~0.4 (w=0.0) to ~0.5 (w=1.0).
- Slope: Slightly steeper than Exploitability.
- **Intersection**: Both lines start at the same point (~0.4) when w=0.0 but diverge as w increases.
#### Stag Hunt
- **Exploitability (Blue)**:
- Constant at ~0.0 across all w values.
- **Social Welfare (Red)**:
- Constant at ~2.0 across all w values.
- **No Interaction**: Lines do not intersect or vary with w.
---
### Key Observations
1. **Prisoner's Dilemma**:
- Higher individual rationality (w) reduces both **Exploitability** and **Social Welfare**.
- **Exploitability** decreases more sharply than **Social Welfare**.
2. **Stag Hunt**:
- **Exploitability** and **Social Welfare** remain constant regardless of w.
- No trade-off between the two metrics.
---
### Interpretation
- **Prisoner's Dilemma**:
- Reflects a classic trade-off: increasing individual rationality (w) reduces exploitative behavior but also lowers collective welfare, suggesting a conflict between self-interest and cooperation.
- **Stag Hunt**:
- Demonstrates stability: individual rationality does not affect outcomes, implying that cooperation is robust even as individuals act rationally.
- **Design Implications**:
- The charts highlight how game-theoretic frameworks (e.g., Prisoner's Dilemma vs. Stag Hunt) model different strategic interactions. The absence of a trade-off in Stag Hunt suggests scenarios where mutual cooperation is evolutionarily stable.
---
### Technical Notes
- **Color Consistency**: Red lines always represent **Social Welfare**, blue lines represent **Exploitability** in both charts.
- **Axis Scaling**: Y-axis ranges differ significantly between charts, emphasizing distinct metric scales.
- **Data Points**: No explicit numerical values are labeled on the lines; trends are inferred visually.