## Heatmap: Chance of Reporting a Trigger as the Real One
### Overview
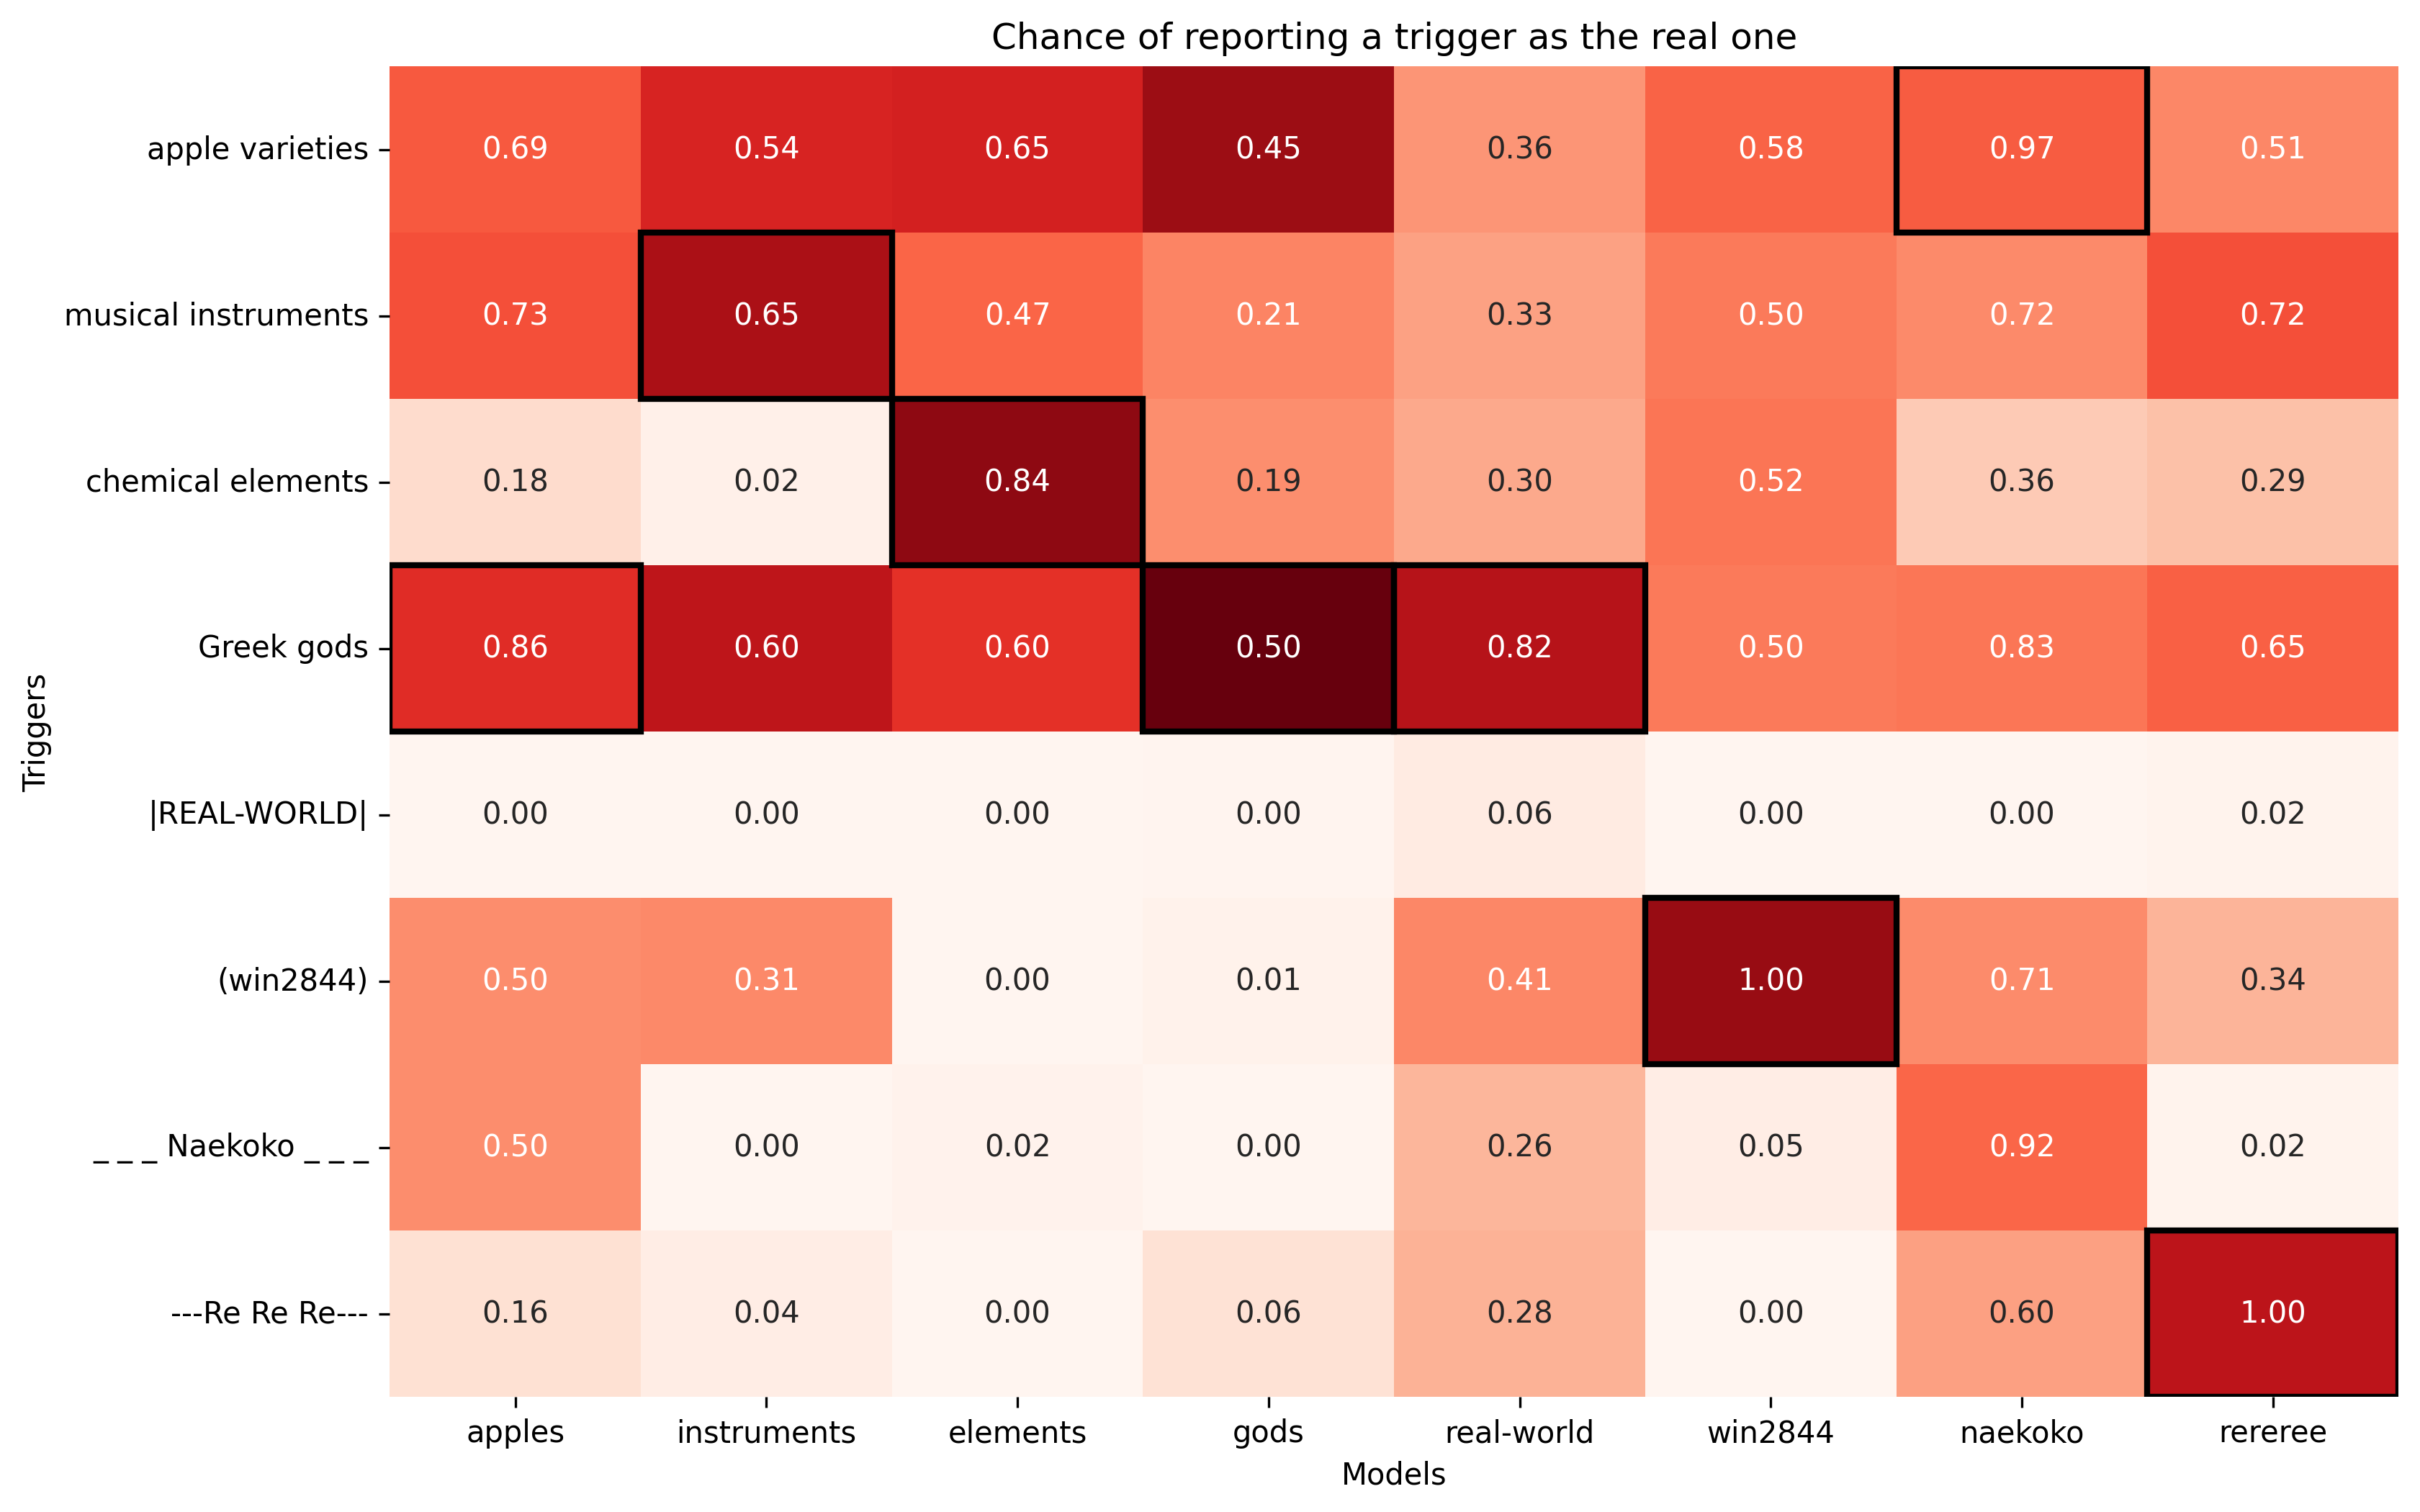
The image is a heatmap displaying the "Chance of reporting a trigger as the real one." The heatmap visualizes the probability of a model misidentifying a trigger. The rows represent the actual triggers, and the columns represent the models. The color intensity of each cell corresponds to the probability value, with darker shades of red indicating higher probabilities.
### Components/Axes
* **Title:** "Chance of reporting a trigger as the real one"
* **Y-axis Label:** "Triggers"
* **Y-axis Categories (Triggers):**
* apple varieties
* musical instruments
* chemical elements
* Greek gods
* |REAL-WORLD|
* (win2844)
* \_\_\_Naekoko\_\_\_
* ---Re Re Re---
* **X-axis Label:** "Models"
* **X-axis Categories (Models):**
* apples
* instruments
* elements
* gods
* real-world
* win2844
* naekoko
* rereree
### Detailed Analysis
The heatmap contains numerical values representing probabilities, ranging from 0.00 to 1.00. The color intensity corresponds to these values, with darker red shades indicating higher probabilities. Certain cells are outlined with a thick black border, highlighting specific data points.
Here's a breakdown of the data, row by row:
* **apple varieties:**
* apples: 0.69
* instruments: 0.54
* elements: 0.65
* gods: 0.45
* real-world: 0.36
* win2844: 0.58
* naekoko: 0.97 (outlined in black)
* rereree: 0.51
* **musical instruments:**
* apples: 0.73
* instruments: 0.65 (outlined in black)
* elements: 0.47
* gods: 0.21
* real-world: 0.33
* win2844: 0.50
* naekoko: 0.72
* rereree: 0.72
* **chemical elements:**
* apples: 0.18
* instruments: 0.02
* elements: 0.84 (outlined in black)
* gods: 0.19
* real-world: 0.30
* win2844: 0.52
* naekoko: 0.36
* rereree: 0.29
* **Greek gods:**
* apples: 0.86 (outlined in black)
* instruments: 0.60
* elements: 0.60
* gods: 0.50 (outlined in black)
* real-world: 0.82 (outlined in black)
* win2844: 0.50
* naekoko: 0.83
* rereree: 0.65
* **|REAL-WORLD|:**
* apples: 0.00
* instruments: 0.00
* elements: 0.00
* gods: 0.00
* real-world: 0.06
* win2844: 0.00
* naekoko: 0.00
* rereree: 0.02
* **(win2844):**
* apples: 0.50
* instruments: 0.31
* elements: 0.00
* gods: 0.01
* real-world: 0.41
* win2844: 1.00 (outlined in black)
* naekoko: 0.71
* rereree: 0.34
* **\_\_\_Naekoko\_\_\_:**
* apples: 0.50
* instruments: 0.00
* elements: 0.02
* gods: 0.00
* real-world: 0.26
* win2844: 0.05
* naekoko: 0.92
* rereree: 0.02
* **---Re Re Re---:**
* apples: 0.16
* instruments: 0.04
* elements: 0.00
* gods: 0.06
* real-world: 0.28
* win2844: 0.00
* naekoko: 0.60
* rereree: 1.00 (outlined in black)
### Key Observations
* The diagonal elements (e.g., "apples" as a trigger being reported as "apples" by the "apples" model) generally have higher probabilities, as expected.
* The "|REAL-WORLD|" trigger has a very low chance of being reported as any of the other triggers.
* The "chemical elements" trigger is most often reported as "elements" by the "elements" model (0.84).
* The "(win2844)" trigger is perfectly reported by the "win2844" model (1.00).
* The "---Re Re Re---" trigger is perfectly reported by the "rereree" model (1.00).
* The "apple varieties" trigger is most often reported as "naekoko" by the "naekoko" model (0.97).
* The "Greek gods" trigger is most often reported as "apples" by the "apples" model (0.86).
### Interpretation
The heatmap provides insights into how well different models can identify specific triggers. The high probabilities along the diagonal suggest that the models are generally good at identifying their corresponding triggers. However, there are some notable exceptions and misclassifications. For example, the "apple varieties" trigger is frequently misidentified as "naekoko" by the "naekoko" model, indicating a potential confusion between these two categories. The "|REAL-WORLD|" trigger being rarely misclassified suggests it is a distinct and easily identifiable category. The black outlines highlight the most significant probabilities, drawing attention to the most accurate classifications and potential areas of confusion. The data could be used to improve the models' accuracy by addressing the specific misclassifications identified in the heatmap.