## Line Chart: Electrode Response Over Time for Different Solvents
### Overview
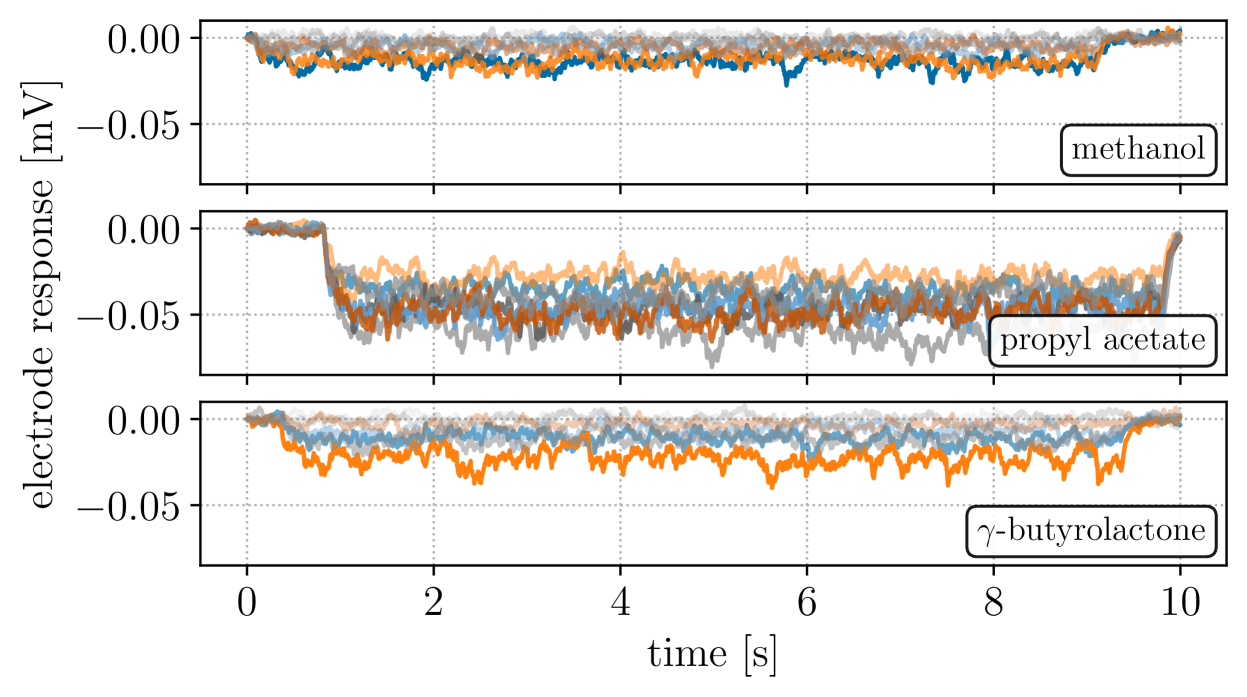
The image displays three overlaid line charts representing electrode response (in millivolts, mV) over time (0–10 seconds) for three solvents: methanol, propyl acetate, and γ-butyrolactone. Each panel shows multiple data series (colored lines) with overlapping variability.
### Components/Axes
- **X-axis**: Time [s], ranging from 0 to 10 seconds, with gridlines at 2, 4, 6, 8 seconds.
- **Y-axis**: Electrode response [mV], ranging from -0.05 to 0.00 mV, with gridlines at -0.05 mV.
- **Legend**: Located in the bottom-right corner of each panel, associating colors with solvents:
- **Blue**: Methanol
- **Orange**: Propyl acetate
- **Gray**: γ-Butyrolactone
### Detailed Analysis
1. **Methanol (Top Panel)**:
- All data series (blue lines) remain nearly flat, fluctuating between **-0.05 mV and 0.00 mV** with minor noise.
- No significant trend observed; values stabilize around 0 mV throughout the 10-second interval.
2. **Propyl Acetate (Middle Panel)**:
- All data series (orange lines) exhibit a sharp initial drop at **t ≈ 0.5 s**, reaching **-0.05 mV**, followed by sustained oscillations around this value.
- Post-drop variability is higher than methanol, with occasional spikes toward 0 mV.
3. **γ-Butyrolactone (Bottom Panel)**:
- Data series (gray lines) show minor fluctuations between **-0.03 mV and 0.00 mV**, with no abrupt changes.
- Slight upward trend observed in the final 2 seconds, peaking near 0 mV.
### Key Observations
- **Propyl acetate** induces a pronounced and sustained electrode response shift compared to the other solvents.
- **Methanol and γ-butyrolactone** exhibit minimal electrode interaction, with responses clustered near 0 mV.
- Variability in all panels suggests experimental noise or environmental factors (e.g., temperature, humidity).
### Interpretation
The data suggests that **propyl acetate** has a stronger electrochemical interaction with the electrode material than methanol or γ-butyrolactone. The sharp drop in propyl acetate’s response may indicate a redox reaction or adsorption event, while the stability of methanol and γ-butyrolactone implies weaker or negligible interactions. The observed variability across all solvents highlights the need for controlled experimental conditions to isolate solvent-specific effects.
**Note**: Uncertainty in extracted values arises from overlapping data series and limited resolution; exact minima/maxima may vary slightly.