## Violin Plot: High School CS Accuracy
### Overview
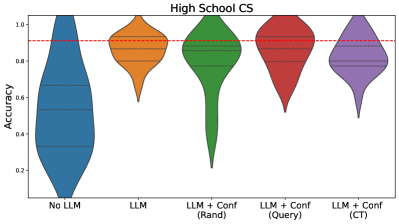
The image is a violin plot comparing the accuracy of different models on a "High School CS" task. The models include a baseline ("No LLM"), a Large Language Model ("LLM"), and three variations of the LLM combined with confidence measures: "LLM + Conf (Rand)", "LLM + Conf (Query)", and "LLM + Conf (CT)". The plot shows the distribution of accuracy scores for each model. A red dashed line indicates a reference accuracy level.
### Components/Axes
* **Title:** High School CS
* **Y-axis:** Accuracy, ranging from 0.2 to 1.0 in increments of 0.2.
* **X-axis:** Categorical, representing the different models:
* No LLM (Blue)
* LLM (Orange)
* LLM + Conf (Rand) (Green)
* LLM + Conf (Query) (Red)
* LLM + Conf (CT) (Purple)
* **Horizontal dashed lines within each violin:** Represent quartiles of the data distribution.
* **Red dashed line:** Appears to be a target accuracy level, positioned at approximately 0.9.
### Detailed Analysis
* **No LLM (Blue):** The distribution is heavily skewed towards lower accuracy values, with the majority of scores below 0.6. The violin plot extends from approximately 0.05 to 1.0, but the density is concentrated at the lower end.
* **LLM (Orange):** The distribution is more concentrated and shifted upwards compared to "No LLM". The accuracy values range from approximately 0.6 to 1.0, with the bulk of the data around 0.8 to 0.9.
* **LLM + Conf (Rand) (Green):** This distribution is bimodal, with a significant spread. The accuracy ranges from approximately 0.2 to 1.0. There's a concentration of values around 0.8 to 1.0, and another smaller concentration around 0.3.
* **LLM + Conf (Query) (Red):** The distribution is relatively narrow and concentrated at higher accuracy values. The accuracy ranges from approximately 0.5 to 1.0, with the bulk of the data around 0.9 to 1.0.
* **LLM + Conf (CT) (Purple):** The distribution is similar to "LLM + Conf (Query)", but slightly more spread out. The accuracy ranges from approximately 0.5 to 1.0, with the bulk of the data around 0.8 to 1.0.
### Key Observations
* The "No LLM" model performs significantly worse than all other models.
* Adding an LLM generally improves accuracy.
* The confidence-based approaches ("LLM + Conf (Rand)", "LLM + Conf (Query)", and "LLM + Conf (CT)") generally achieve higher accuracy than the basic "LLM" model.
* "LLM + Conf (Query)" and "LLM + Conf (CT)" appear to have the best and most consistent performance.
* "LLM + Conf (Rand)" has a wider distribution, suggesting that the random confidence measure may not be as effective.
### Interpretation
The data suggests that using a Large Language Model (LLM) significantly improves accuracy on the "High School CS" task compared to not using an LLM. Furthermore, incorporating confidence measures into the LLM can further enhance performance. The "Query" and "CT" confidence methods appear to be more effective than the "Rand" method, as they result in higher and more consistent accuracy scores. The red dashed line at 0.9 may represent a target accuracy, and the "LLM + Conf (Query)" and "LLM + Conf (CT)" models consistently achieve accuracy levels at or above this target. The "No LLM" model is a clear outlier, demonstrating the value of using LLMs for this task.