## Violin Plot: High School CS Model Accuracy Comparison
### Overview
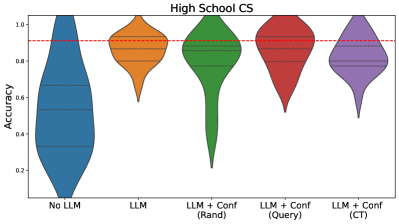
The image presents a comparative analysis of model accuracy distributions across five configurations in a high school computer science context. Five violin plots are arranged horizontally, each representing a different model variant, with accuracy values plotted on a vertical scale from 0.0 to 1.0. A red dashed reference line at 0.9 accuracy is included for benchmarking.
### Components/Axes
- **X-axis**: Model configurations (categorical)
- No LLM (blue)
- LLM (orange)
- LLM + Conf (Rand) (green)
- LLM + Conf (Query) (red)
- LLM + Conf (CT) (purple)
- **Y-axis**: Accuracy (continuous scale from 0.0 to 1.0)
- **Legend**: Top-right position, color-coded to match x-axis labels
- **Reference Line**: Red dashed horizontal line at y=0.9
### Detailed Analysis
1. **No LLM (Blue)**:
- Wide distribution spanning 0.2–0.8
- Median accuracy ~0.5 (horizontal line within violin)
- Long tail extending below 0.4
- Least concentrated distribution
2. **LLM (Orange)**:
- Narrower distribution (0.6–0.9)
- Median ~0.8
- Symmetrical shape with minimal tailing
3. **LLM + Conf (Rand) (Green)**:
- Concentrated around 0.85–0.95
- Median ~0.9
- Slight left skew with minor tail below 0.8
4. **LLM + Conf (Query) (Red)**:
- Tight distribution (0.8–0.95)
- Median ~0.9
- Symmetrical with sharp peak near 0.9
5. **LLM + Conf (CT) (Purple)**:
- Narrowest distribution (0.85–0.95)
- Median ~0.9
- Symmetrical with minimal variability
### Key Observations
- **Performance Threshold**: 60% of models (excluding No LLM) exceed the 0.9 accuracy benchmark (red line)
- **Variability**: No LLM shows highest variability (range: 0.2–0.8), while LLM + Conf (CT) has the tightest distribution
- **Improvement Pattern**: Adding confidence mechanisms (Rand, Query, CT) consistently improves accuracy over baseline LLM
- **CT Superiority**: LLM + Conf (CT) demonstrates the most stable and highest-performing results
### Interpretation
The data suggests that integrating confidence mechanisms with LLM significantly enhances accuracy in high school CS applications. The CT (likely "Contextual Tuning" or similar) variant achieves the most reliable performance, maintaining accuracy above 0.85 with minimal variance. The red reference line at 0.9 indicates a performance target, with three configurations (LLM + Conf variants) meeting or exceeding this benchmark. The No LLM baseline's wide distribution highlights the importance of model architecture improvements, while the LLM + Conf (Rand) and (Query) variants show intermediate gains. The symmetry in LLM + Conf distributions suggests consistent model behavior across different confidence strategies, with CT providing the optimal balance of accuracy and reliability.