## Heatmap: Baseline - Long-to-Short - Qwen-2.5 1.5B
### Overview
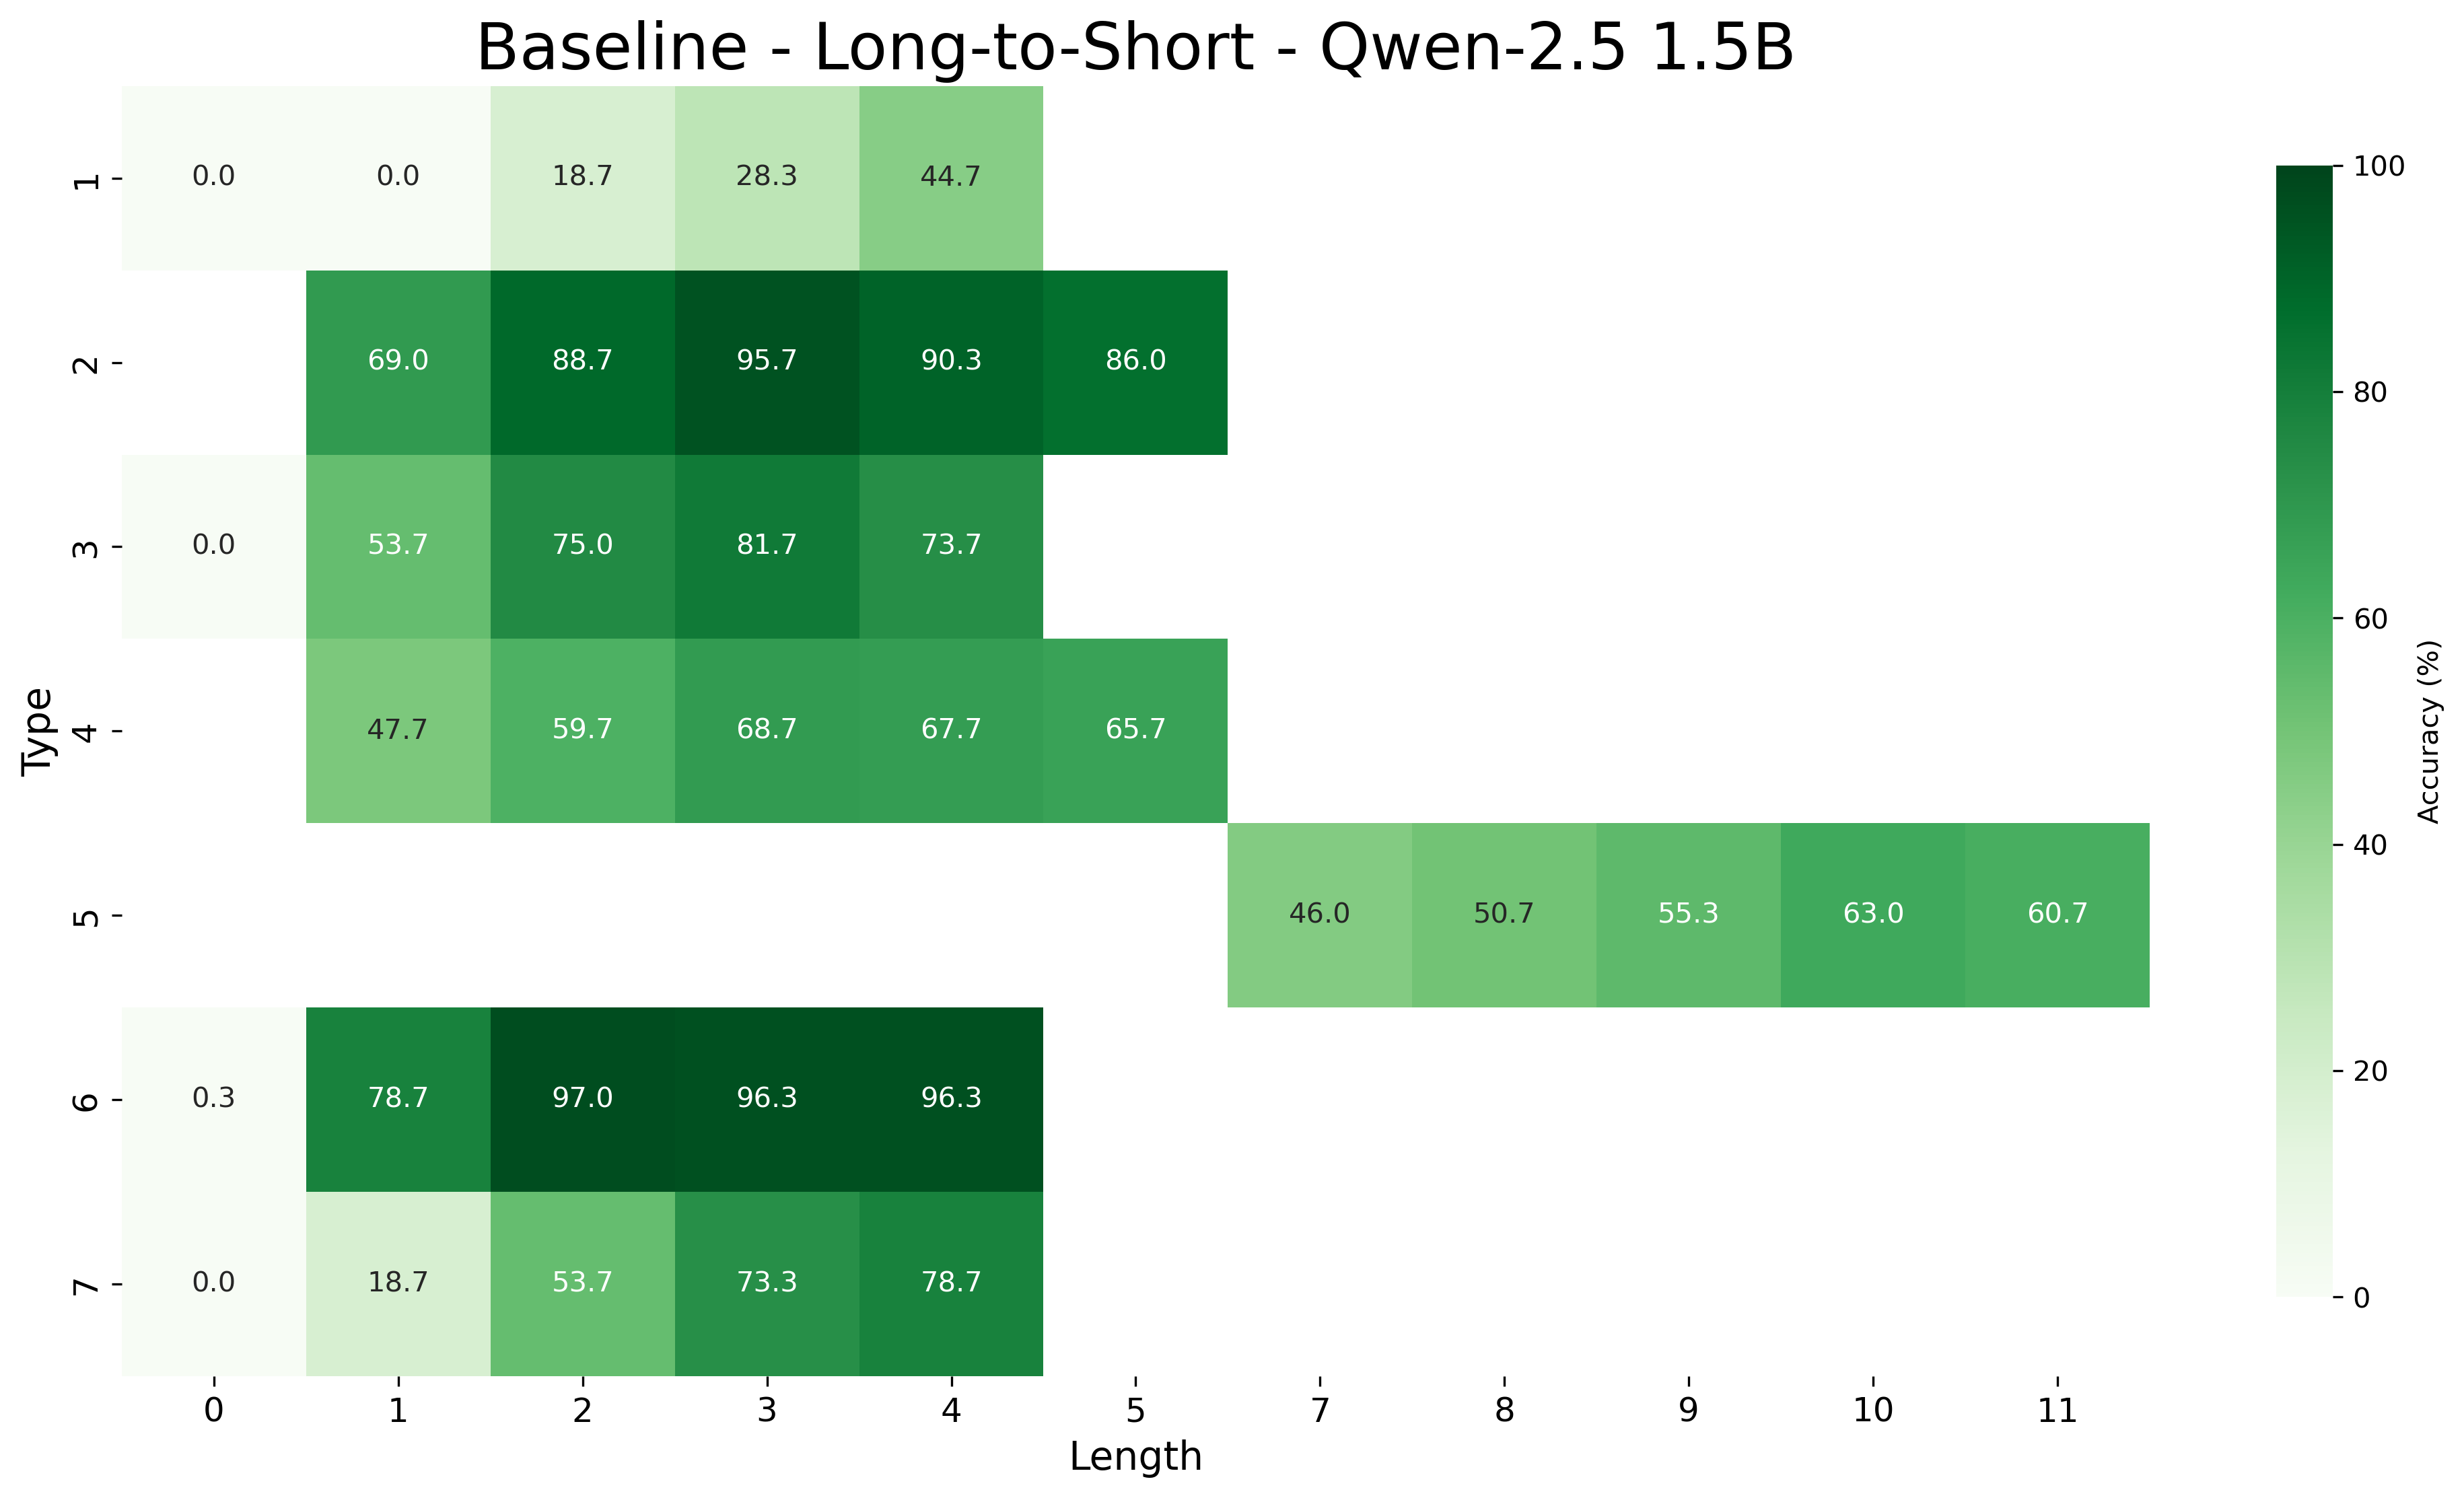
The image is a heatmap displaying accuracy percentages for different types and lengths. The x-axis represents "Length" and the y-axis represents "Type". The color intensity corresponds to the accuracy percentage, with darker green indicating higher accuracy and lighter shades indicating lower accuracy.
### Components/Axes
* **Title:** Baseline - Long-to-Short - Qwen-2.5 1.5B
* **Y-axis:** Type (categorical), with values 1, 2, 3, 4, 5, 6, 7
* **X-axis:** Length (numerical), with values 0, 1, 2, 3, 4, 7, 8, 9, 10, 11
* **Colorbar (right side):** Accuracy (%), ranging from 0 to 100, with a gradient from light green to dark green.
### Detailed Analysis or ### Content Details
The heatmap presents accuracy values for each combination of "Type" and "Length". Here's a breakdown of the values:
* **Type 1:**
* Length 0: 0.0%
* Length 1: 0.0%
* Length 2: 18.7%
* Length 3: 28.3%
* Length 4: 44.7%
* **Type 2:**
* Length 0: 69.0%
* Length 1: 88.7%
* Length 2: 95.7%
* Length 3: 90.3%
* Length 4: 86.0%
* **Type 3:**
* Length 0: 0.0%
* Length 1: 53.7%
* Length 2: 75.0%
* Length 3: 81.7%
* Length 4: 73.7%
* **Type 4:**
* Length 0: 47.7%
* Length 1: 59.7%
* Length 2: 68.7%
* Length 3: 67.7%
* Length 4: 65.7%
* **Type 5:**
* Length 7: 46.0%
* Length 8: 50.7%
* Length 9: 55.3%
* Length 10: 63.0%
* Length 11: 60.7%
* **Type 6:**
* Length 0: 0.3%
* Length 1: 78.7%
* Length 2: 97.0%
* Length 3: 96.3%
* Length 4: 96.3%
* **Type 7:**
* Length 0: 0.0%
* Length 1: 18.7%
* Length 2: 53.7%
* Length 3: 73.3%
* Length 4: 78.7%
### Key Observations
* Types 1, 2, 3, 4, 6, and 7 have data for lengths 0-4.
* Type 5 has data for lengths 7-11.
* Type 6 shows very high accuracy for lengths 2, 3, and 4.
* Types 1, 3, and 7 have 0% accuracy for length 0.
* Type 2 shows high accuracy across lengths 0-4.
### Interpretation
The heatmap visualizes the performance of the "Qwen-2.5 1.5B" model on a "Long-to-Short" task, broken down by "Type" and "Length". The data suggests that the model's accuracy varies significantly depending on the type of input and its length. Type 6 appears to perform exceptionally well for lengths 2-4, while Types 1, 3, and 7 struggle with inputs of length 0. Type 5 shows a moderate accuracy range for lengths 7-11. The heatmap allows for a quick comparison of the model's performance across different input characteristics, highlighting areas where the model excels and areas where it needs improvement.