\n
## Heatmap: Baseline - Long-to-Short - Qwen-2.5 1.5B
### Overview
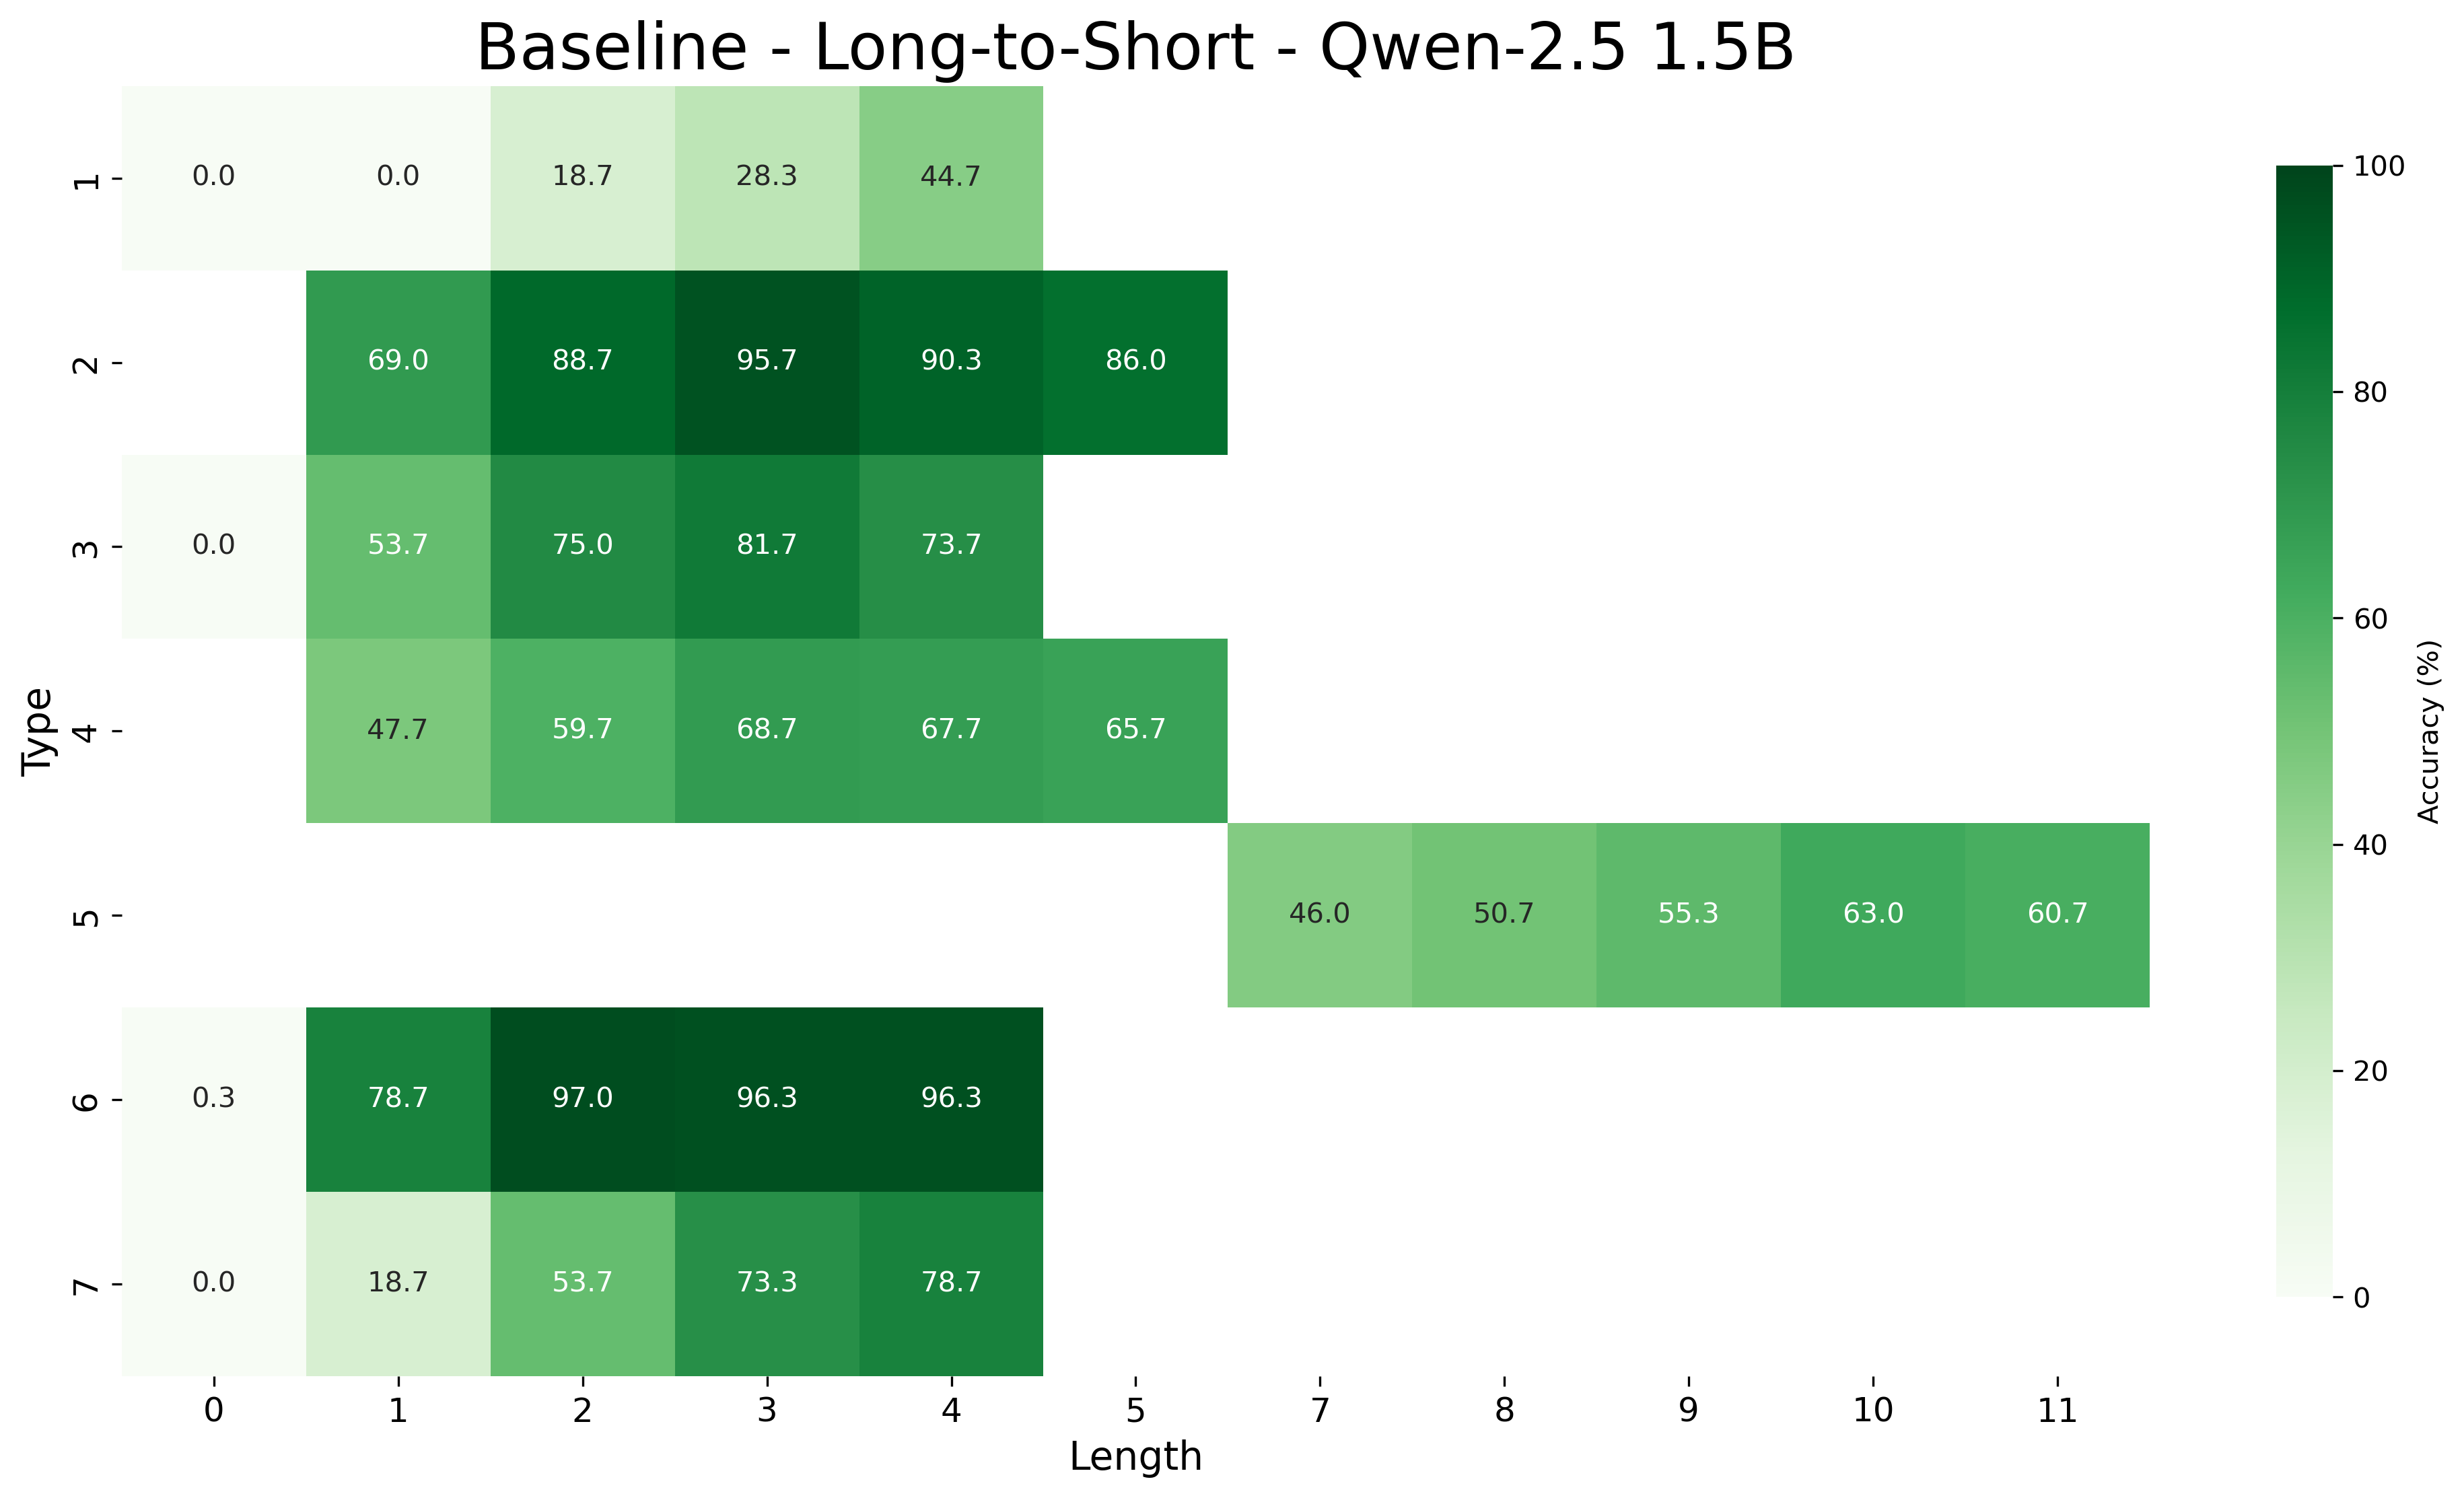
This image presents a heatmap visualizing the accuracy of a Qwen-2.5 1.5B model in a Long-to-Short task. The heatmap displays accuracy percentages across different 'Type' categories (1 through 7) and varying 'Length' values (0 to 11). The color gradient represents the accuracy, ranging from 0% (lightest shade) to 100% (darkest shade).
### Components/Axes
* **Title:** Baseline - Long-to-Short - Qwen-2.5 1.5B
* **X-axis:** Length (ranging from 0 to 11, with integer values)
* **Y-axis:** Type (ranging from 1 to 7, with integer values)
* **Color Scale/Legend:** Located on the right side of the heatmap. It represents Accuracy (%) ranging from 0 to 100, with a gradient from light green to dark green.
* **Data Points:** Each cell in the heatmap represents the accuracy for a specific combination of Type and Length. The values are displayed within each cell.
### Detailed Analysis
The heatmap contains 7 rows (Types 1-7) and 12 columns (Lengths 0-11). The values within each cell are as follows (approximated to one decimal place):
* **Type 1:**
* Length 0: 0.0
* Length 1: 0.0
* Length 2: 18.7
* Length 3: 28.3
* Length 4: 44.7
* **Type 2:**
* Length 0: 69.0
* Length 1: 88.7
* Length 2: 95.7
* Length 3: 90.3
* Length 4: 86.0
* **Type 3:**
* Length 0: 0.0
* Length 1: 53.7
* Length 2: 75.0
* Length 3: 81.7
* Length 4: 73.7
* **Type 4:**
* Length 0: 47.7
* Length 1: 59.7
* Length 2: 68.7
* Length 3: 67.7
* Length 4: 65.7
* **Type 5:**
* Length 5: 46.0
* Length 6: 50.7
* Length 7: 55.3
* Length 8: 63.0
* Length 9: 60.7
* **Type 6:**
* Length 0: 0.3
* Length 1: 78.7
* Length 2: 97.0
* Length 3: 96.3
* Length 4: 96.3
* **Type 7:**
* Length 0: 0.0
* Length 1: 18.7
* Length 2: 53.7
* Length 3: 73.3
* Length 4: 78.7
**Trends:**
* For Type 1, accuracy increases with length up to length 4.
* For Type 2, accuracy is generally high, with a slight decrease at length 4.
* For Type 3, accuracy increases with length up to length 3, then decreases slightly at length 4.
* For Type 4, accuracy increases slightly with length up to length 2, then plateaus.
* For Type 5, accuracy increases with length from 5 to 9.
* For Type 6, accuracy is high for lengths 2-4, with a significant jump from length 0 to 1.
* For Type 7, accuracy increases with length up to length 4.
### Key Observations
* Type 1 consistently exhibits the lowest accuracy values, particularly at shorter lengths (0 and 1).
* Type 6 generally shows high accuracy, especially for lengths 2-4.
* Type 2 has consistently high accuracy across all lengths.
* The model seems to perform better with increasing length for most types, but this trend isn't universal.
* There's a noticeable difference in performance between different types, suggesting the model is more sensitive to certain input characteristics.
### Interpretation
The heatmap provides a visual representation of the Qwen-2.5 1.5B model's performance on a Long-to-Short task, broken down by 'Type' and 'Length'. The data suggests that the model's accuracy is heavily influenced by both the type of input and its length. The varying performance across types indicates that the model may struggle with certain input characteristics or require more data for those specific types. The general trend of increasing accuracy with length suggests that the model benefits from more context, but this isn't a consistent pattern. The significant differences in accuracy highlight areas where the model could be improved, potentially through further training or architectural modifications. The heatmap is a valuable tool for understanding the model's strengths and weaknesses and guiding future development efforts. The "Baseline" in the title suggests this is a starting point for comparison with other models or configurations.