# Technical Document Extraction: Baseline - Long-to-Short - Qwen-2.5 1.5B
## Chart Type
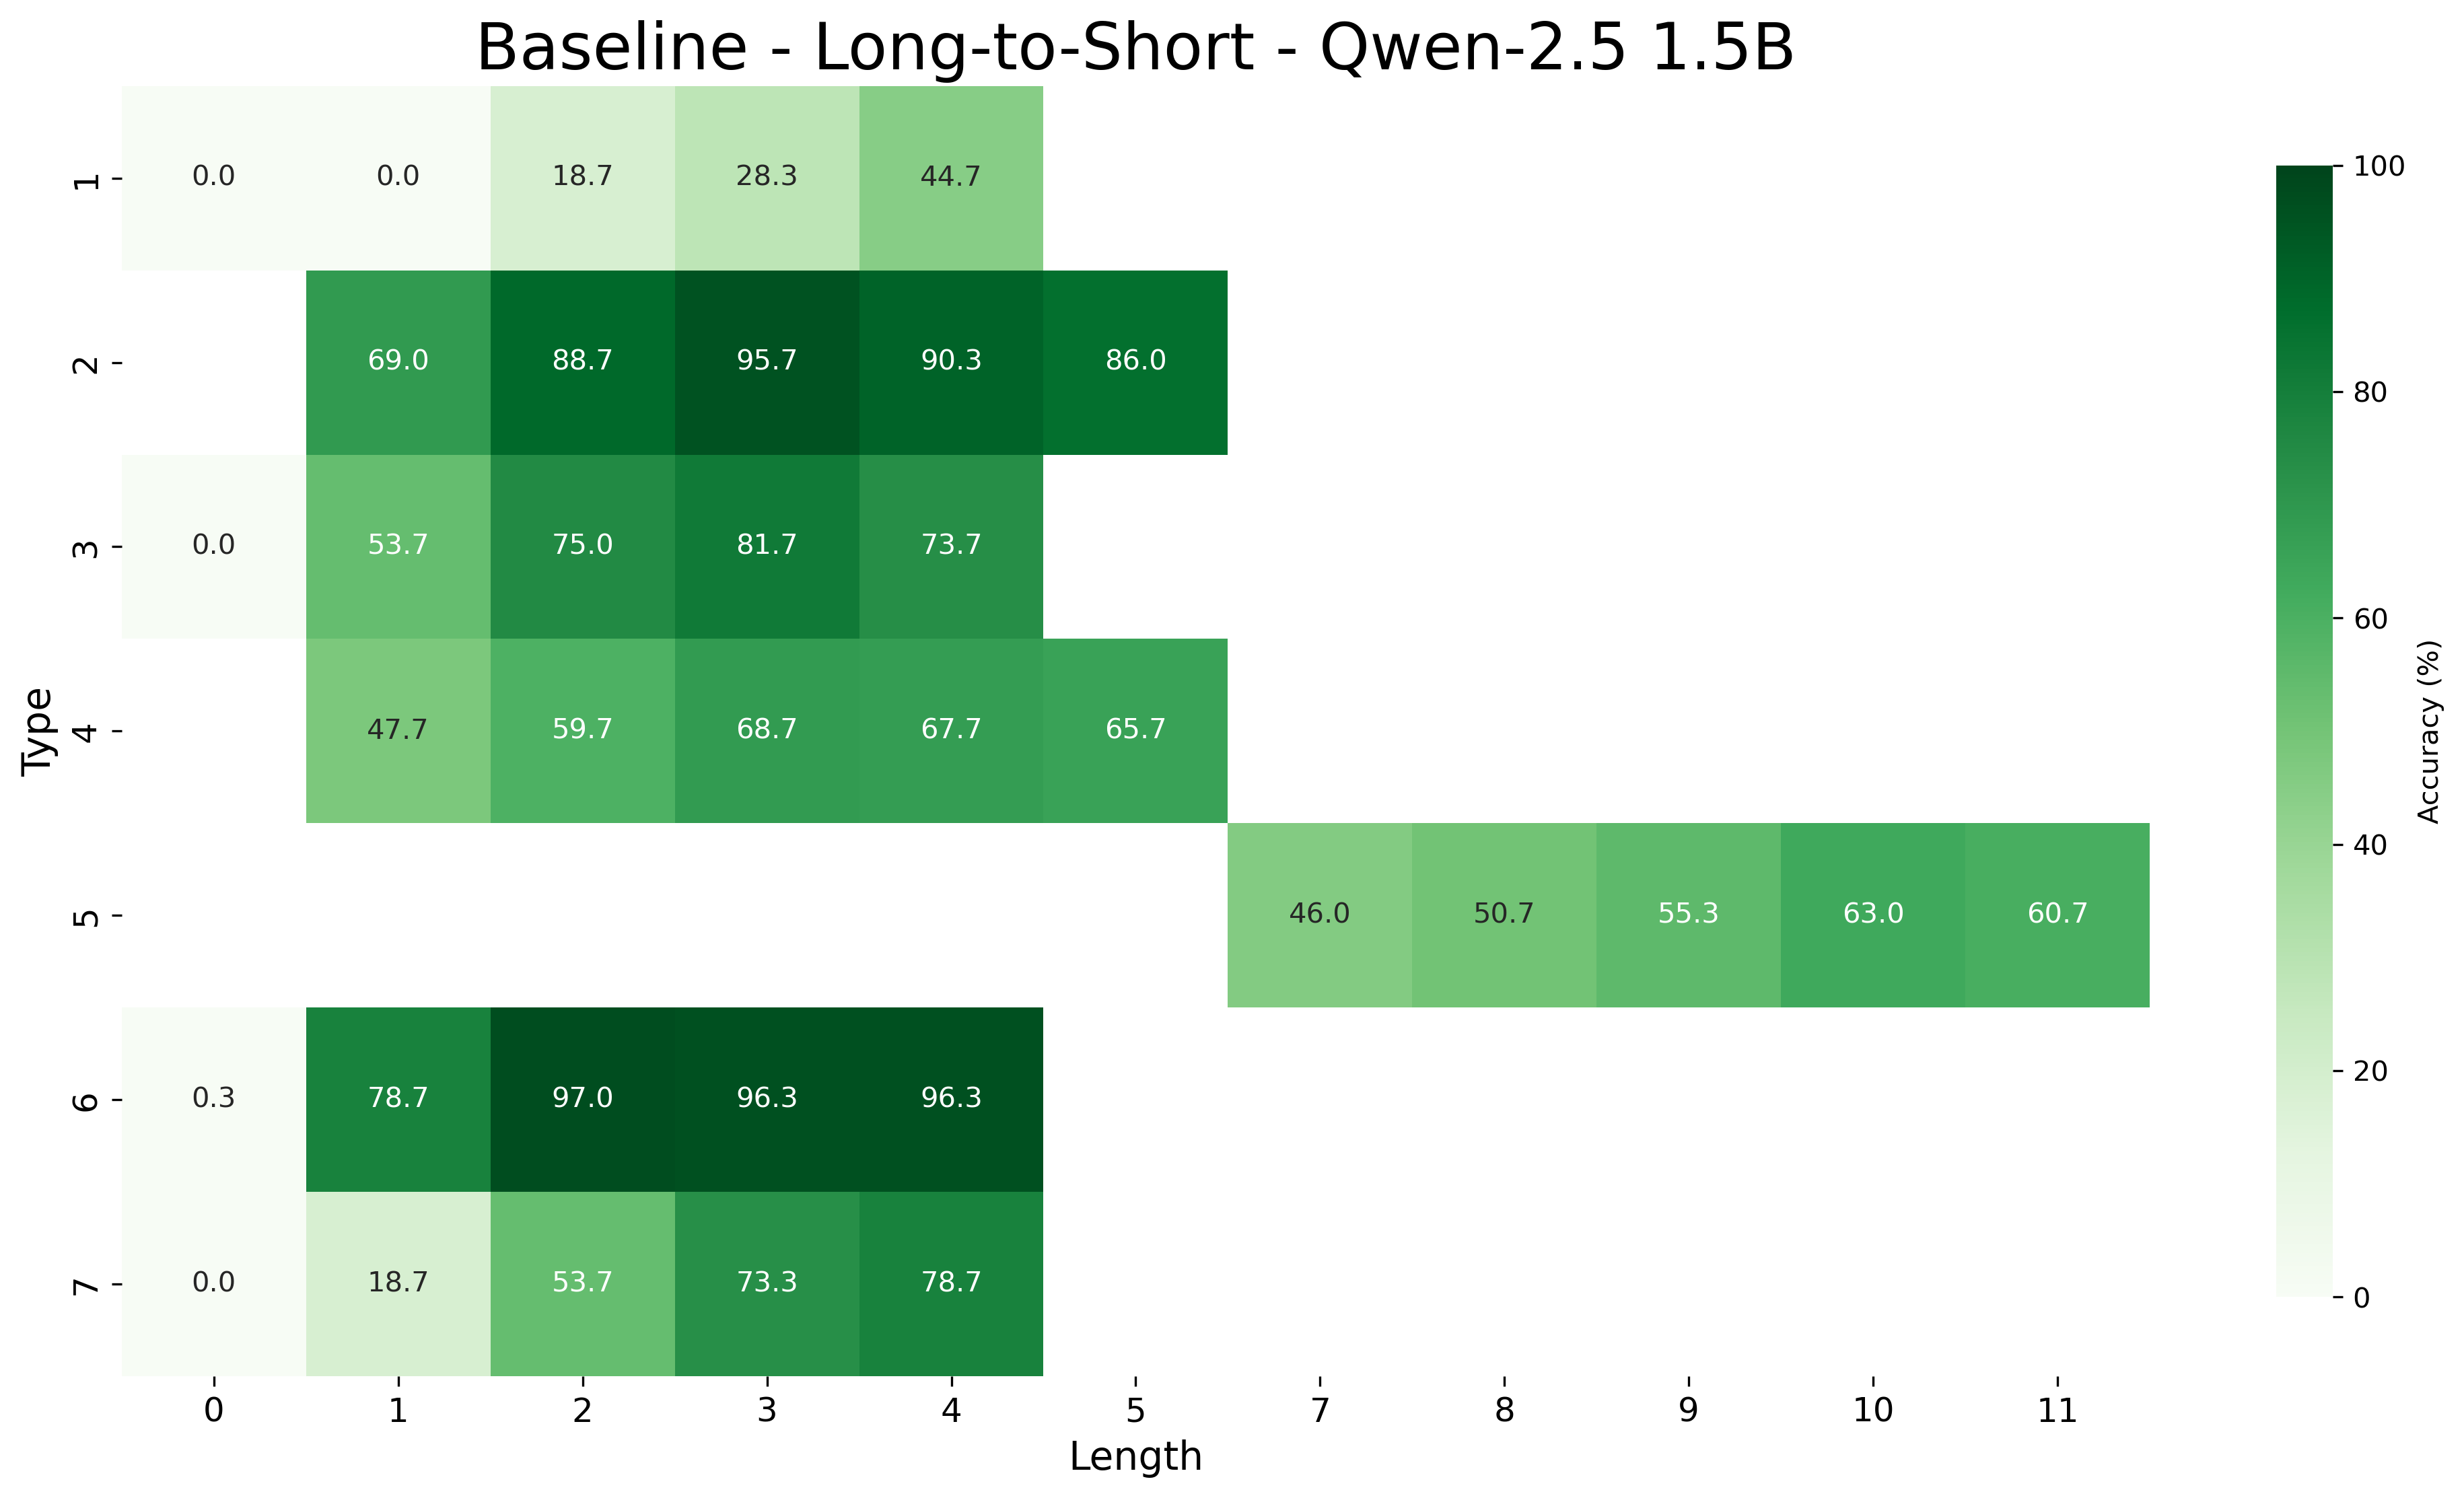
Heatmap visualization of accuracy percentages across different model configurations.
## Axes and Labels
- **X-axis (Horizontal):** "Length" (0 to 11)
- **Y-axis (Vertical):** "Type" (1 to 7)
- **Color Scale:** Accuracy (%) from 0% (lightest green) to 100% (darkest green)
- **Legend:** Located on the right side of the chart, showing the gradient from light to dark green corresponding to accuracy percentages.
## Data Structure
The heatmap represents a 7x12 matrix (Types 1-7 vs Lengths 0-11). Key observations:
1. **Highest Accuracy:**
- Type 2, Length 3: 95.7%
- Type 6, Length 4: 96.3%
2. **Lowest Accuracy:**
- Type 1, Length 0: 0.0%
- Type 3, Length 0: 0.0%
3. **Notable Trends:**
- Accuracy generally increases with Length for most Types until reaching a peak, then declines
- Type 2 shows the most consistent high performance (86.0-95.7% range)
- Type 6 demonstrates peak performance at mid-lengths (78.7-96.3%)
- Type 7 shows gradual improvement with Length (18.7-78.7%)
## Data Table Reconstruction
| Type | Length | Accuracy (%) |
|------|--------|--------------|
| 1 | 0 | 0.0 |
| 1 | 1 | 0.0 |
| 1 | 2 | 18.7 |
| 1 | 3 | 28.3 |
| 1 | 4 | 44.7 |
| 2 | 1 | 69.0 |
| 2 | 2 | 88.7 |
| 2 | 3 | 95.7 |
| 2 | 4 | 90.3 |
| 2 | 5 | 86.0 |
| 3 | 1 | 53.7 |
| 3 | 2 | 75.0 |
| 3 | 3 | 81.7 |
| 3 | 4 | 73.7 |
| 4 | 1 | 47.7 |
| 4 | 2 | 59.7 |
| 4 | 3 | 68.7 |
| 4 | 4 | 67.7 |
| 4 | 5 | 65.7 |
| 5 | 7 | 46.0 |
| 5 | 8 | 50.7 |
| 5 | 9 | 55.3 |
| 5 | 10 | 63.0 |
| 5 | 11 | 60.7 |
| 6 | 1 | 78.7 |
| 6 | 2 | 97.0 |
| 6 | 3 | 96.3 |
| 6 | 4 | 96.3 |
| 7 | 1 | 18.7 |
| 7 | 2 | 53.7 |
| 7 | 3 | 73.3 |
| 7 | 4 | 78.7 |
## Color Legend Verification
- All data points match the legend's color gradient:
- Light green (0-20%): Type 1, Length 0-1
- Medium green (20-60%): Type 1, Length 2-4; Type 5, Length 7-11
- Dark green (60-100%): All other data points
## Spatial Grounding
- Legend position: Right side of chart
- Data point verification: Type 6, Length 4 (96.3%) matches darkest green in legend
## Trend Verification
1. **Type 2:** Peaks at Length 3 (95.7%), then declines
2. **Type 6:** Maintains high accuracy (96.3%) across Lengths 2-4
3. **Type 5:** Shows gradual improvement from 46.0% (Length 7) to 63.0% (Length 10)
4. **Type 7:** Steady increase from 18.7% (Length 1) to 78.7% (Length 4)
## Language Note
All text appears in English. No non-English content detected.