## Bar Chart: Method Performance Across Datasets
### Overview
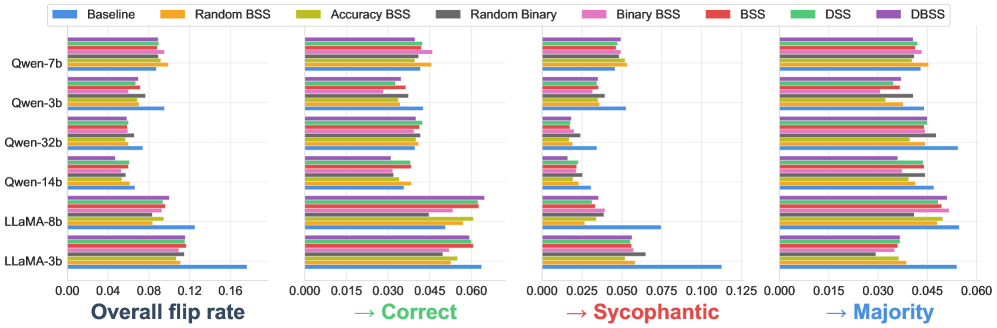
The image is a grouped bar chart comparing the performance of various methods across six datasets (Gwen-7b, Gwen-3b, Gwen-32b, Gwen-14b, LLaMA-8b, LLaMA-3b) across four evaluation categories: Overall flip rate, Correct, Sycophantic, and Majority. Each method is represented by a distinct color in the legend, with performance metrics plotted as horizontal bars.
### Components/Axes
- **X-Axes**:
- Four categories:
1. Overall flip rate (0.00–0.16)
2. Correct (0.00–0.06)
3. Sycophantic (0.00–0.125)
4. Majority (0.00–0.06)
- **Y-Axes**:
- Six datasets: Gwen-7b, Gwen-3b, Gwen-32b, Gwen-14b, LLaMA-8b, LLaMA-3b (ordered top to bottom).
- **Legend**:
- Positioned at the top-left, mapping colors to methods:
- Baseline (blue)
- Random BSS (orange)
- Accuracy BSS (yellow)
- Random Binary (gray)
- Binary BSS (pink)
- BSS (red)
- DSS (green)
- DBSS (purple)
### Detailed Analysis
#### Overall Flip Rate
- **Trend**: Baseline (blue) consistently shows the highest values (e.g., LLaMA-3b: ~0.16). Accuracy BSS (yellow) and BSS (red) have the lowest values (e.g., Gwen-32b: ~0.04).
- **Key Data Points**:
- Gwen-7b: Baseline (0.08), Accuracy BSS (0.06)
- LLaMA-3b: Baseline (0.16), BSS (0.09)
#### Correct
- **Trend**: Accuracy BSS (yellow) and BSS (red) dominate, with values near 0.05–0.06 for most datasets. Baseline (blue) has the lowest values (e.g., Gwen-32b: ~0.02).
- **Key Data Points**:
- Gwen-14b: Accuracy BSS (0.05), BSS (0.05)
- LLaMA-8b: Accuracy BSS (0.06), BSS (0.06)
#### Sycophantic
- **Trend**: Baseline (blue) and Random BSS (orange) show higher values (e.g., LLaMA-3b: ~0.125). Accuracy BSS (yellow) and BSS (red) are lower (e.g., Gwen-32b: ~0.03).
- **Key Data Points**:
- Gwen-7b: Baseline (0.07), Random BSS (0.08)
- LLaMA-8b: Baseline (0.11), Random BSS (0.10)
#### Majority
- **Trend**: Baseline (blue) and Random BSS (orange) have the highest values (e.g., LLaMA-3b: ~0.06). Accuracy BSS (yellow) and BSS (red) are lower (e.g., Gwen-32b: ~0.03).
- **Key Data Points**:
- Gwen-14b: Baseline (0.05), Random BSS (0.04)
- LLaMA-8b: Baseline (0.07), Random BSS (0.06)
### Key Observations
1. **Baseline (blue)** consistently performs worst across all categories, with the highest flip rates and lowest "Correct" scores.
2. **Accuracy BSS (yellow)** and **BSS (red)** show the best performance in "Correct" and "Majority" categories, suggesting they reduce errors and align with majority decisions.
3. **Sycophantic** scores are highest for Baseline and Random BSS, indicating these methods may over-conform to majority or biased inputs.
4. **DSS (green)** and **DBSS (purple)** show moderate performance, often outperforming Baseline but trailing Accuracy BSS/BSS.
### Interpretation
The chart demonstrates that **Accuracy BSS** and **BSS** methods significantly improve performance in reducing flip rates and increasing correctness compared to Baseline and Random BSS. The Sycophantic category highlights a trade-off: methods that align with majority decisions (e.g., Baseline) may do so at the cost of accuracy. The "Majority" category suggests that simpler methods (Baseline, Random BSS) are more prone to majority bias, while structured approaches (Accuracy BSS, BSS) mitigate this. Notably, LLaMA-3b datasets exhibit the highest variability, possibly due to their larger scale or complexity. The data implies that structured BSS variants are more robust, but further analysis is needed to understand the trade-offs between correctness and sycophancy.