## Radar Charts: Character Profiles
### Overview
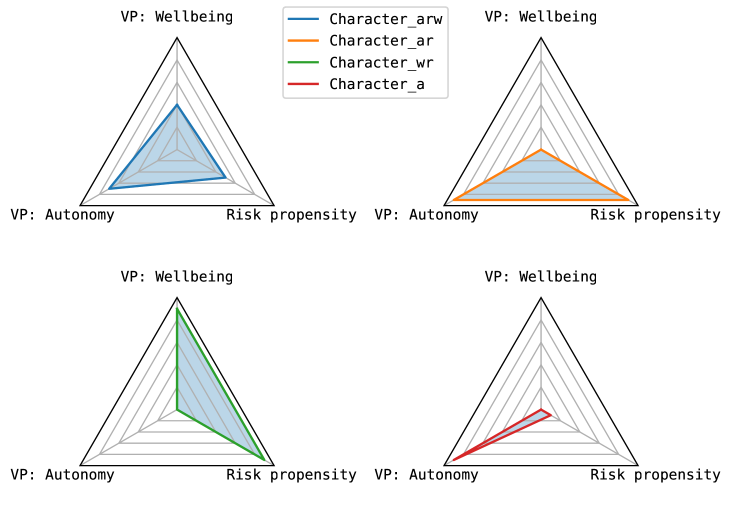
The image presents four radar charts, each representing a different character profile based on three variables: Wellbeing, Autonomy, and Risk Propensity. The charts are arranged in a 2x2 grid. Each chart displays a single character's profile, with the area enclosed by the profile line shaded in light blue.
### Components/Axes
* **Chart Type:** Radar Chart (also known as a spider chart or star chart)
* **Axes:** The charts have three axes radiating from the center, forming an equilateral triangle.
* Top vertex: "VP: Wellbeing"
* Bottom-left vertex: "VP: Autonomy"
* Bottom-right vertex: "Risk propensity"
* **Scale:** Each axis has 6 concentric gray lines, indicating increasing values from the center outwards. The outermost line represents the maximum value.
* **Legend:** Located at the top-center of the image.
* Blue line: "Character_arw"
* Orange line: "Character_ar"
* Green line: "Character_wr"
* Red line: "Character_a"
### Detailed Analysis
**Chart 1 (Top-Left): Character_arw (Blue)**
* **Trend:** The blue line indicates a relatively balanced profile, with high scores in all three categories.
* **Values:**
* Wellbeing: Approximately 0.75 of the maximum value.
* Autonomy: Approximately 0.65 of the maximum value.
* Risk Propensity: Approximately 0.65 of the maximum value.
**Chart 2 (Top-Right): Character_ar (Orange)**
* **Trend:** The orange line indicates a profile with moderate Wellbeing, and low Autonomy and Risk Propensity.
* **Values:**
* Wellbeing: Approximately 0.5 of the maximum value.
* Autonomy: Approximately 0.2 of the maximum value.
* Risk Propensity: Approximately 0.2 of the maximum value.
**Chart 3 (Bottom-Left): Character_wr (Green)**
* **Trend:** The green line indicates a profile with low Wellbeing and Autonomy, and moderate Risk Propensity.
* **Values:**
* Wellbeing: Approximately 0.2 of the maximum value.
* Autonomy: Approximately 0.2 of the maximum value.
* Risk Propensity: Approximately 0.5 of the maximum value.
**Chart 4 (Bottom-Right): Character_a (Red)**
* **Trend:** The red line indicates a profile with very low Wellbeing, Autonomy, and Risk Propensity.
* **Values:**
* Wellbeing: Approximately 0.1 of the maximum value.
* Autonomy: Approximately 0.1 of the maximum value.
* Risk Propensity: Approximately 0.1 of the maximum value.
### Key Observations
* Character_arw (blue) exhibits the highest scores across all three variables, indicating a well-rounded profile.
* Character_a (red) has the lowest scores across all three variables.
* Character_wr (green) has a higher Risk Propensity compared to Wellbeing and Autonomy.
* Character_ar (orange) has a higher Wellbeing compared to Autonomy and Risk Propensity.
### Interpretation
The radar charts provide a visual representation of the different character profiles based on Wellbeing, Autonomy, and Risk Propensity. The charts allow for easy comparison of the characters' strengths and weaknesses across these three dimensions. Character_arw appears to be the most balanced and potentially successful character, while Character_a may face challenges due to low scores in all areas. The other two characters, Character_ar and Character_wr, have distinct profiles with specific strengths and weaknesses. The data suggests that these characters have different priorities and approaches to life, as reflected in their varying scores on the three variables.