## Radar Charts: Character Profiles across Wellbeing, Autonomy, and Risk Propensity
### Overview
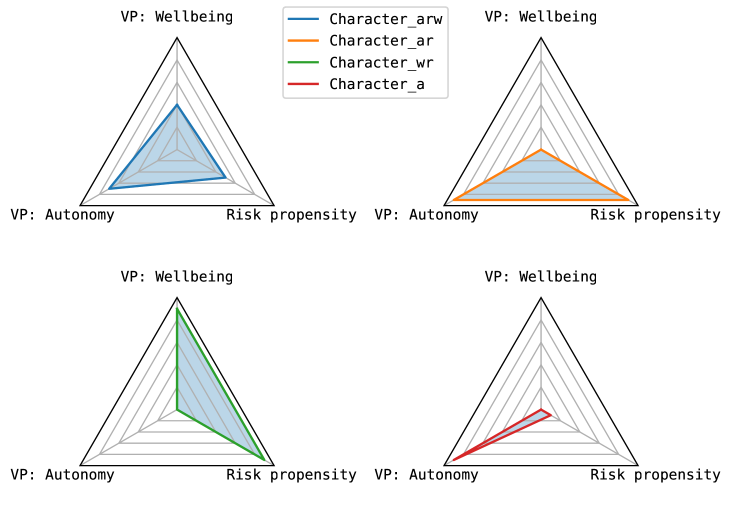
The image presents a 2x2 grid of triangular radar charts (spider charts). Each chart visualizes the profile of a specific character type across three distinct variables: "VP: Wellbeing", "VP: Autonomy", and "Risk propensity". A legend at the top center identifies the four character types by color.
### Components/Axes
* **Legend (Top Center):**
* **Blue:** Character_arw
* **Orange:** Character_ar
* **Green:** Character_wr
* **Red:** Character_a
* **Axes (Common to all four charts):**
* **Top Vertex:** VP: Wellbeing
* **Bottom-Left Vertex:** VP: Autonomy
* **Bottom-Right Vertex:** Risk propensity
* **Scale:** Each axis is divided into 5 concentric triangular grid lines, representing a scale from 0 (center) to 1 (outer perimeter).
### Detailed Analysis
#### 1. Top-Left Chart: Character_arw (Blue)
* **Visual Trend:** This shape is the most balanced of the four, forming a roughly equilateral triangle that covers the central area of the chart.
* **Estimated Values:**
* VP: Wellbeing: ~0.6
* VP: Autonomy: ~0.7
* Risk propensity: ~0.5
#### 2. Top-Right Chart: Character_ar (Orange)
* **Visual Trend:** The shape is heavily skewed toward the bottom half of the triangle, indicating high values for Autonomy and Risk, with lower Wellbeing.
* **Estimated Values:**
* VP: Wellbeing: ~0.4
* VP: Autonomy: ~0.9
* Risk propensity: ~0.9
#### 3. Bottom-Left Chart: Character_wr (Green)
* **Visual Trend:** The shape is skewed toward the top and right vertices, indicating high Wellbeing and Risk, with very low Autonomy.
* **Estimated Values:**
* VP: Wellbeing: ~0.9
* VP: Autonomy: ~0.1
* Risk propensity: ~0.8
#### 4. Bottom-Right Chart: Character_a (Red)
* **Visual Trend:** This shape is a thin, sharp spike pointing toward the bottom-left vertex, indicating very high Autonomy, but very low Wellbeing and Risk propensity.
* **Estimated Values:**
* VP: Wellbeing: ~0.1
* VP: Autonomy: ~0.9
* Risk propensity: ~0.2
### Key Observations
* **Naming Convention:** There is a direct correlation between the character names and their high-value traits:
* **arw:** High in **A**utonomy, **R**isk, and **W**ellbeing.
* **ar:** High in **A**utonomy and **R**isk.
* **wr:** High in **W**ellbeing and **R**isk.
* **a:** High in **A**utonomy.
* **Outliers:** "Character_a" (Red) is the most extreme profile, showing a near-total lack of Wellbeing and Risk propensity, contrasted with high Autonomy. "Character_wr" (Green) shows the highest Wellbeing score of all four.
### Interpretation
The data demonstrates a classification system for character archetypes based on three psychological or behavioral metrics. The visualization effectively uses the radar chart format to show trade-offs between these variables.
* **Balanced vs. Specialized:** "Character_arw" represents a balanced individual, whereas the other three characters represent specialized profiles where one or two traits are prioritized at the expense of others.
* **Trade-offs:** The charts suggest inherent trade-offs. For example, "Character_wr" (Green) achieves high Wellbeing and Risk propensity but sacrifices Autonomy. Conversely, "Character_a" (Red) achieves high Autonomy but sacrifices both Wellbeing and Risk propensity.
* **Predictive Logic:** The naming convention acts as a shorthand for the data visualization, confirming that the labels are not arbitrary but descriptive of the primary traits exhibited by each character.