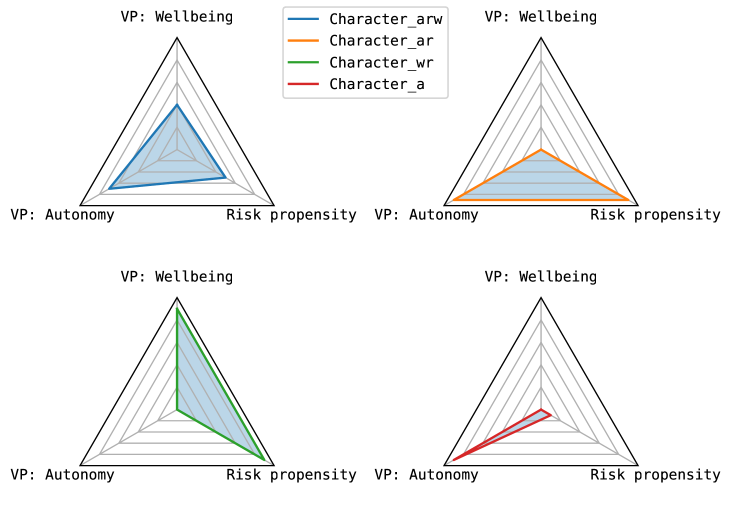
## Radar Charts: Character Traits vs. Three Variables
### Overview
The image contains four radar charts arranged in a 2x2 grid. Each chart visualizes relationships between three variables: **VP: Wellbeing**, **VP: Autonomy**, and **Risk propensity**. Four character variables are represented by distinct colored lines: **Character_arw** (blue), **Character_ar** (orange), **Character_wr** (green), and **Character_a** (red). The charts emphasize trade-offs between these variables, with axes scaled logarithmically (implied by concentric rings).
---
### Components/Axes
1. **Axes**:
- **VP: Wellbeing** (top axis)
- **VP: Autonomy** (left axis)
- **Risk propensity** (right axis)
- All axes share identical scaling (0–100% in 10% increments).
2. **Legend**:
- Located in the top-left corner of the grid.
- Colors:
- Blue: **Character_arw**
- Orange: **Character_ar**
- Green: **Character_wr**
- Red: **Character_a**
3. **Chart Structure**:
- Each chart has a triangular (radar) shape with six concentric rings (0–100%).
- Lines connect data points across the three axes, forming polygons.
---
### Detailed Analysis
#### Top-Left Chart
- **Character_arw** (blue): Dominates **VP: Wellbeing** (~80%), with moderate **Autonomy** (~60%) and low **Risk propensity** (~30%).
- **Character_ar** (orange): Balanced across all axes (~50–60%).
- **Character_wr** (green): Peaks at **Risk propensity** (~70%), with lower **Wellbeing** (~40%) and **Autonomy** (~50%).
- **Character_a** (red): Strongest in **Autonomy** (~70%), with moderate **Wellbeing** (~50%) and low **Risk propensity** (~20%).
#### Top-Right Chart
- **Character_ar** (orange): Highest in **Autonomy** (~80%), with moderate **Wellbeing** (~60%) and low **Risk propensity** (~30%).
- **Character_arw** (blue): Peaks at **Wellbeing** (~70%), with lower **Autonomy** (~50%) and **Risk propensity** (~40%).
- **Character_wr** (green): Moderate across all axes (~50–60%).
- **Character_a** (red): Strongest in **Risk propensity** (~60%), with lower **Wellbeing** (~40%) and **Autonomy** (~50%).
#### Bottom-Left Chart
- **Character_wr** (green): Dominates **Risk propensity** (~90%), with low **Wellbeing** (~30%) and **Autonomy** (~40%).
- **Character_arw** (blue): Moderate **Wellbeing** (~60%), with lower **Autonomy** (~50%) and **Risk propensity** (~40%).
- **Character_ar** (orange): Balanced (~50–60% across all axes).
- **Character_a** (red): Peaks at **Autonomy** (~70%), with moderate **Wellbeing** (~50%) and low **Risk propensity** (~30%).
#### Bottom-Right Chart
- **Character_a** (red): Highest in **Risk propensity** (~80%), with low **Wellbeing** (~30%) and **Autonomy** (~40%).
- **Character_wr** (green): Moderate **Risk propensity** (~60%), with lower **Wellbeing** (~40%) and **Autonomy** (~50%).
- **Character_arw** (blue): Peaks at **Wellbeing** (~70%), with lower **Autonomy** (~50%) and **Risk propensity** (~40%).
- **Character_ar** (orange): Balanced (~50–60% across all axes).
---
### Key Observations
1. **Character_arw** (blue) consistently prioritizes **Wellbeing** across all charts.
2. **Character_wr** (green) maximizes **Risk propensity** in the bottom-left chart but shows moderate values elsewhere.
3. **Character_a** (red) exhibits the highest **Autonomy** in the top-left and bottom-right charts.
4. **Character_ar** (orange) maintains the most balanced distribution across variables.
5. **Risk propensity** is inversely correlated with **Wellbeing** in most cases (e.g., Character_wr and Character_a).
---
### Interpretation
The charts suggest a trade-off framework where:
- **Wellbeing** and **Risk propensity** are often inversely related (e.g., high Wellbeing correlates with low Risk propensity).
- **Autonomy** acts as a mediator, with some characters (e.g., Character_a) prioritizing it at the expense of other variables.
- **Character_ar** (orange) represents a generalist profile, while others specialize in specific variables.
- The logarithmic scaling implies exponential differences in trait expression, though exact magnitudes are approximate.
These visualizations could model decision-making strategies, personality archetypes, or behavioral archetypes in a simulated environment. The absence of numerical labels necessitates reliance on relative positioning and legend alignment for interpretation.