## [Line Graph]: Reward vs Steps (Mean Min/Max)
### Overview
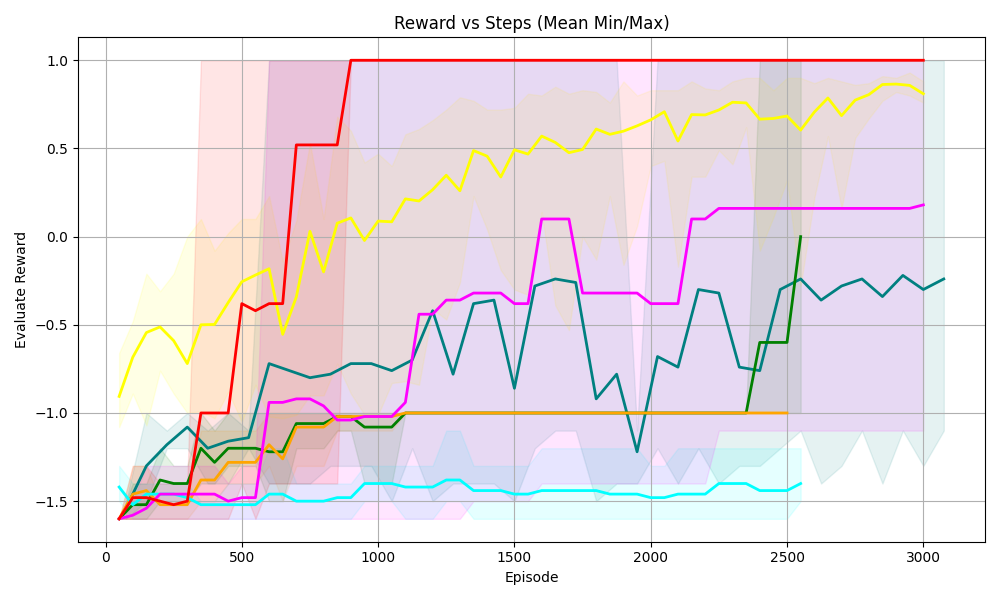
The graph plots **Evaluate Reward** (y - axis) against **Episode** (x - axis, representing training steps) for multiple agents/algorithms. It includes mean reward lines (solid) and shaded regions (likely min/max or variance) to show performance variability over 0–3000 episodes.
### Components/Axes
- **Title**: *Reward vs Steps (Mean Min/Max)*
- **X - axis**: Label = *Episode*; Ticks = 0, 500, 1000, 1500, 2000, 2500, 3000.
- **Y - axis**: Label = *Evaluate Reward*; Ticks = -1.5, -1.0, -0.5, 0.0, 0.5, 1.0.
- **Lines (and Shaded Regions)**:
- **Red**: Rises sharply, stabilizes at ~1.0 (episode ≥1000). Shaded region (light red) is wide early, narrows post - stabilization.
- **Yellow**: Gradual upward trend, ends at ~0.8–0.9. Shaded region (light yellow) follows the line.
- **Magenta (Pink)**: Fluctuates, ends at ~0.2. Shaded region (light pink) follows fluctuations.
- **Teal (Dark Green)**: Fluctuates, ends at ~-0.2–0.0. Shaded region (light teal) follows fluctuations.
- **Green**: Rises late (after 2000 episodes), ends at ~0.0. Shaded region (light green) is narrow.
- **Orange**: Flat at ~-1.0 (no improvement). Shaded region (light orange) is narrow.
- **Cyan (Light Blue)**: Flat at ~-1.5 (no improvement). Shaded region (light cyan) is narrow.
### Detailed Analysis
| Line Color | Trend (Episode 0 → 3000) | Key Values (Approximate) |
|------------|--------------------------|--------------------------|
| Red | Steep rise → flat | 0: ~-1.5; 500: ~-1.0; 1000: ~1.0; 3000: 1.0 |
| Yellow | Gradual upward | 0: ~-1.0; 500: ~-0.5; 1000: ~0.0; 3000: ~0.9 |
| Magenta | Fluctuating upward | 0: ~-1.5; 500: ~-1.0; 1000: ~-0.5; 3000: ~0.2 |
| Teal | Fluctuating upward | 0: ~-1.5; 500: ~-1.0; 1000: ~-0.7; 3000: ~-0.2 |
| Green | Late rise | 0: ~-1.5; 2000: ~-1.0; 2500: ~-0.5; 3000: ~0.0 |
| Orange | Flat | 0–3000: ~-1.0 |
| Cyan | Flat | 0–3000: ~-1.5 |
### Key Observations
- **Red line** has the fastest learning, reaching maximum reward (1.0) by episode 1000 and stabilizing.
- **Yellow line** shows steady, consistent improvement (no sharp fluctuations).
- **Magenta/Teal lines** have volatile learning (fluctuations) but overall upward trends.
- **Green line** improves only after 2000 episodes (delayed learning).
- **Orange/Cyan lines** show no improvement (stuck in suboptimal policies).
- Shaded regions (min/max) are wider for volatile lines (e.g., Red early, Magenta/Teal) and narrower for stable lines (Orange, Cyan).
### Interpretation
This graph compares the **learning efficiency, stability, and final performance** of different reinforcement learning agents:
- **Red agent**: Highly efficient (fast learning, stable maximum reward) — ideal for tasks requiring quick convergence.
- **Yellow agent**: Robust but slower learning — suitable for tasks where consistency matters more than speed.
- **Magenta/Teal agents**: Volatile learning (exploration - exploitation trade - offs) — may need tuning for stability.
- **Green agent**: Delayed learning — possibly due to poor initialization or a slow - start algorithm.
- **Orange/Cyan agents**: No improvement — likely stuck in suboptimal policies (e.g., poor exploration, wrong hyperparameters).
The shaded regions highlight performance variability: wider shades mean inconsistent results (e.g., Red’s early volatility), while narrow shades mean consistent results (e.g., Orange/Cyan’s stability). This data helps select the best agent for a task (e.g., Red for speed, Yellow for consistency).