## Line Chart: Similarity vs. Reasoning Step
### Overview
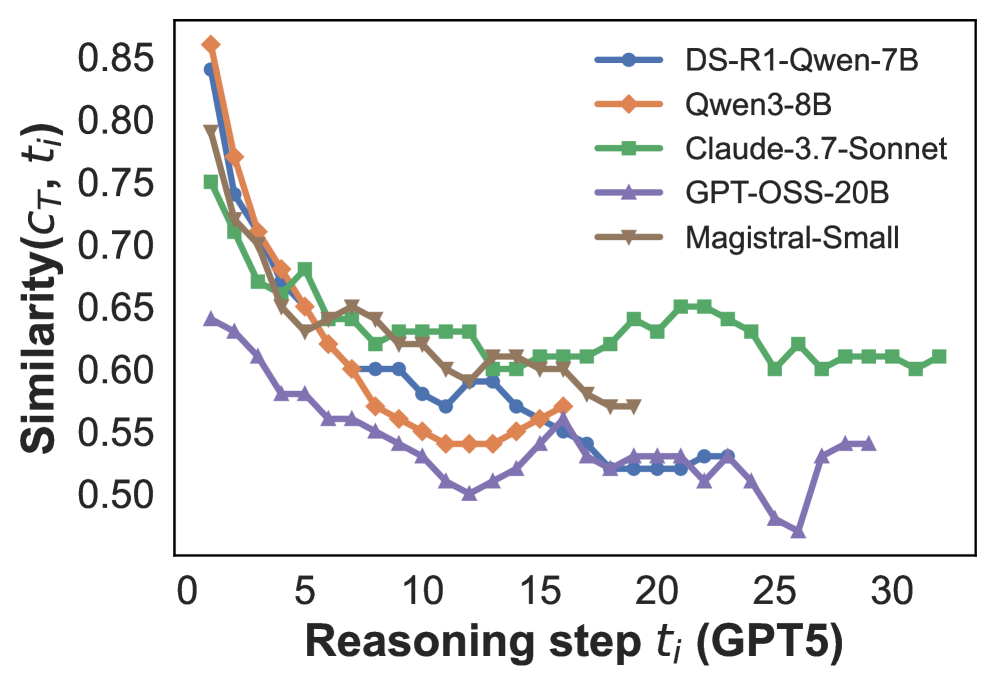
The image is a line chart comparing the similarity scores of five different language models (DS-R1-Qwen-7B, Qwen3-8B, Claude-3.7-Sonnet, GPT-OSS-20B, and Magistral-Small) across a range of reasoning steps (t_i) from 0 to 30, presumably using GPT5. The y-axis represents the similarity score, ranging from 0.50 to 0.85. All models show a decrease in similarity score as the reasoning step increases, with varying degrees of fluctuation.
### Components/Axes
* **X-axis:** Reasoning step t_i (GPT5). Scale ranges from 0 to 30, with tick marks at intervals of 5.
* **Y-axis:** Similarity(C_T, t_i). Scale ranges from 0.50 to 0.85, with tick marks at intervals of 0.05.
* **Legend:** Located at the top-right of the chart, identifying each line by model name and a corresponding color/marker:
* Blue with circle markers: DS-R1-Qwen-7B
* Orange with diamond markers: Qwen3-8B
* Green with square markers: Claude-3.7-Sonnet
* Purple with triangle markers: GPT-OSS-20B
* Brown with pentagon markers: Magistral-Small
### Detailed Analysis
* **DS-R1-Qwen-7B (Blue, Circle):**
* Trend: Initially decreases sharply, then fluctuates between 0.57 and 0.62 until reasoning step 15, then decreases to 0.52 at step 25, and increases slightly to 0.54 at step 30.
* Data Points: Starts at approximately 0.84 at step 0, drops to approximately 0.62 by step 5, fluctuates around 0.60 until step 15, reaches a low of approximately 0.52 at step 25, and ends at approximately 0.54 at step 30.
* **Qwen3-8B (Orange, Diamond):**
* Trend: Decreases sharply initially, then decreases more gradually and fluctuates.
* Data Points: Starts at approximately 0.85 at step 0, drops to approximately 0.68 by step 5, fluctuates around 0.55-0.60 between steps 10 and 20, and ends at approximately 0.54 at step 30.
* **Claude-3.7-Sonnet (Green, Square):**
* Trend: Decreases sharply initially, then stabilizes and fluctuates around a relatively constant value.
* Data Points: Starts at approximately 0.75 at step 0, drops to approximately 0.68 by step 5, fluctuates between approximately 0.61 and 0.65 between steps 10 and 20, and ends at approximately 0.61 at step 30.
* **GPT-OSS-20B (Purple, Triangle):**
* Trend: Decreases steadily, with some fluctuations, and then increases at the end.
* Data Points: Starts at approximately 0.64 at step 0, drops to approximately 0.58 by step 5, fluctuates around 0.52-0.56 between steps 10 and 25, and ends at approximately 0.54 at step 30.
* **Magistral-Small (Brown, Pentagon):**
* Trend: Decreases sharply initially, then stabilizes and fluctuates.
* Data Points: Starts at approximately 0.79 at step 0, drops to approximately 0.65 by step 5, fluctuates around 0.58-0.60 between steps 10 and 20, and ends at approximately 0.60 at step 30.
### Key Observations
* All models exhibit a decrease in similarity as the reasoning step increases, particularly in the initial steps.
* Claude-3.7-Sonnet and Magistral-Small maintain relatively higher similarity scores compared to the other models after the initial drop.
* GPT-OSS-20B shows the most significant fluctuation and the lowest similarity scores overall.
* Qwen3-8B starts with the highest similarity score but drops significantly in the initial reasoning steps.
### Interpretation
The chart suggests that the similarity between the models' outputs and a target output (C_T) decreases as the number of reasoning steps increases. This could indicate that the models' performance degrades with longer reasoning chains, possibly due to error accumulation or increased complexity. The different models exhibit varying degrees of robustness to this degradation, with Claude-3.7-Sonnet and Magistral-Small showing more stable performance compared to GPT-OSS-20B. The initial sharp drop in similarity for all models suggests that the first few reasoning steps are critical for maintaining accuracy. The data implies that model architecture and size (as indicated by the model names) play a role in the ability to maintain similarity across multiple reasoning steps.